The Well-Kept Secrets of Blood: The Mechanism of a Vital Fluid
Arnaud Benchetrite, Ines Hafit, Laura Hebert, Shiyuan Qiao
Abstract
This essay will explore blood but will more specifically approach its viscoelasticity to better understand the circulation through the body that is responsible for many important functions. Unlike most common fluids, such as water, blood has non-Newtonian properties and shear-thinning properties that result in the variation of its viscosity under different shearing forces. This variation is due to the aggregation and deformation of erythrocytes. Erythrocytes are a main component of blood and their most important role is to exchange nutrients — such as oxygen — with waste products, such as carbon dioxide, with tissue cells. The lifetime reaches 120 days (Elblbesy, 2018) and researchers have proved that in this amount of time they may travel about 500 kilometers (Elblbesy, 2018) through blood vessels. While moving through the smaller vessels from arterioles to capillaries to venules to veins, erythrocytes experience a variety of blood vessel sizes and linings. These vessel characteristics cause blood cells to undergo force and interact with their surroundings, according to varying degrees of blood flow and the deformation of erythrocytes (Gupta and Shea, 2019). The adaptations of blood are very efficient and numerous, and can provide much inspiration for future work in bioengineering.
Composition and Function of Blood
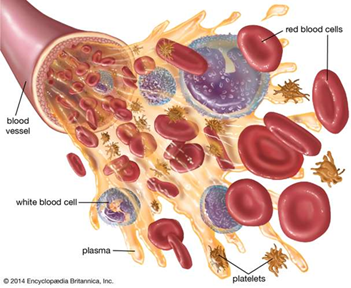
Blood is a body fluid in humans and many other animals that transports oxygen and nutrients to the cells and carries away carbon dioxide and other waste products. In mammals, blood has a similar composition but differs principally in terms of sizes or repartition of its components. It is pumped by the heart through the circulatory system in the body. Blood is not a uniform red liquid and is constituted of many different components which assure three principal functions: transport, protection and regulation.
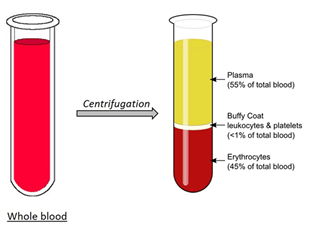
Blood is mainly composed of plasma, the “yellow” — after centrifugation — liquid part of blood in which erythrocytes (i.e., red blood cells), leukocytes (i.e., white blood cells) and platelets are suspended in. Plasma is principally made of water (+ 90 %) but is a mixture of proteins, enzymes, nutrients, wastes, hormones and gases (“Blood plasma” | Horiba, n.d.).
First, proteins play an important role in plasma and constitute the most abundance substance in terms of weight. They serve several functions: suppliers of amino acids for cell nutrition – macrophages from other organs break down plasma proteins so that amino acids are released and used by other cells to synthesize their assigned products, carriers for other molecules, pH stabilizers – functioning as weak bases to bind with H+ ions, helping blood to coagulate and preventing loss of blood or invasion by foreign microorganisms or viruses, inducing colloid osmotic pressure (i.e., displacement of water molecules between blood and tissue fluid) (“Blood function and composition” | HealthEngine, 2019) .
However, plasma also contains and transports several nutrients (e.g., glucose, amino acids, fats, vitamins, etc.) absorbed by the digestive tract, some dissolved gases like oxygen, carbon dioxide or even nitrogen, and few nitrogenous wastes – toxic products from chemical reactions in the body (“Blood function and composition” | HealthEngine, 2019).
The blood is also composed of erythrocytes, also known as red blood cells, which give the coloration – red hemoglobins – that we know. They are responsible for the transport of oxygen and carbon dioxide through the body. They pick up oxygen from the lungs and deliver it to many tissues (e.g., muscle, nervous, connective and epithelial) and carry waste carbon dioxide from tissues to the lungs – some of it is converted in bicarbonate by enzymes and is dissolved and transported into plasma. Erythrocytes are disc-shaped cells with a thick rim and a thin sunken center (“Blood function and composition” | HealthEngine, 2019). They do not contain mitochondria or nucleus and are very small (6-8 μm). Their shape and size allow them to stretch, bend and fold as they are being compressed in small blood vessels and to get back to their original form when they travel into much larger vessels – their inner surface contains two proteins giving the membrane resilience, flexibility and durability: actin and spectrin (“40.2 Components of the Blood” | OpenStax, 2012). Red blood cells are produced in bone marrow by stem cells but take some days before becoming mature – about 5 days from reticulocyte to mature red blood cells – and have a lifespan of approximately 120 days. Their production is regulated by the hormone erythropoietin, which is released by the kidneys in response to low oxygen levels (“40.2 Components of the Blood” | OpenStax, 2012). Their cytoplasm consists mainly of a 33 % solution — 96 % of the dry content in weight — of red hemoglobin – made up of four globulin chains and carries oxygen. There are about 5 million red blood cells in a single droplet of blood (“The Composition and Function of Blood” | Professor Dave Explains | YouTube, 2019).
Leukocytes — or white blood cells — only constitute 1 % of the total volume of blood in a healthy adult body (“40.2 Components of the Blood” | OpenStax, 2012) but are necessary for the protection of the body. In fact, they are cells of the immune system and contribute to the immune response against infectious diseases and foreign invaders. Unlike erythrocytes, they are nucleated and independently motile. However, they can be divided into two categories: granulocytes and agranulocytes. Granulocytes contain organelles named granules because of their look through light microscopy while agranulocytes do not, consisting of lymphocytes and monocytes — immune defences (“40.2 Components of the Blood” | OpenStax, 2012). There are three types of granulocytes: neutrophils — or polymorphonuclear — which help destroy bacteria and inhibit its growth, eosinophils which are bigger and aim at destroying allergens or inflammatory chemicals and releasing enzymes that disable parasites, and basophils which, by secreting histamine and heparin, help increase tissue blood flow — dilatation of vessels — and improve circulation of leukocytes by preventing clotting (i.e., they act as anticoagulants) (“40.2 Components of the Blood” | OpenStax, 2012). On the other hand, lymphocytes are responsible for the destruction of cancer cells, viruses and other foreign invaders. There are three principal types of lymphocytes — T, B and NK — serving different functions: coordinate actions of other immune cells, secrete antibodies, and serve in immune memory (“40.2 Components of the Blood” | OpenStax, 2012). Lymphocytes T are involved in cell-mediated immunity (e.g., activation of phagocytes, specific cytotoxic T-lymphocytes for cell destroying and cytokines for cell signaling). Lymphocytes B are in charge of humoral immunity (e.g., secretion of antibodies, complement proteins or host defense peptides). Finally, natural killer cells play a role in the innate immune system by modulating functions of other immune cells (like macrophages or T cells), distinguishing tumors and infected cells, and mostly releasing cytotoxic granules to destroy altered cells (Cohn et al. 2014).
Monocytes are much larger elements; they have an abundant cytoplasm and function in differentiating into macrophages (phagocytic cells which can digest pathogens and dead cells) and in presenting antigens (to activate other immune cells) (“40.2 Components of the Blood” | OpenStax, 2012).
Thrombocytes, also known as platelets, are small fragments of cytoplasm that are derived from megakaryocytes — large bone marrow cells producing 2000-5000 platelets each by fragmenting. They therefore do not contain a nucleus, are very small (2-4 μm) and are not really classified as cells themselves. They play an important role in the blood clotting and have many functions (“40.2 Components of the Blood” | OpenStax, 2012).
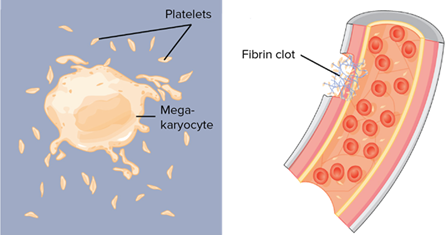
In vascular spasms (i.e., tightening of muscle cells inside the walls of a blood vessel to limit blood flow to tissue, preventing blood loss), platelets release serotonin, a chemical vasoconstrictor to maintain it long enough for other mechanisms to come into play. They can also reduce or stop minor bleedings by accumulating on the wall of damaged blood vessels (platelet plug). Finally, in coagulation, they accumulate with the other blood cells on fibrin – sticky protein that adheres to the vessel walls and synthesized by another plasma protein – to seal the break in the blood vessel (“40.2 Components of the Blood” | OpenStax, 2012).
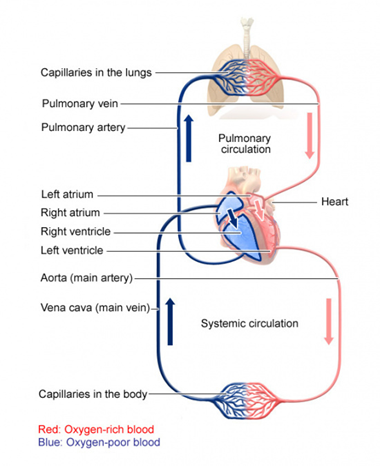
However, blood is transported through the body by the cardiovascular system — or circulatory system. It mainly consists of the heart and the blood vessels running through the entire body. Arteries carry blood away from the heart while veins carry it back to the heart. The structure of this system could be associated with a tree since the main artery — the aorta — branches into large arteries leading to smaller and smaller vessels until it ends in the capillary network, where the exchange of many substances takes place: oxygen, water, glucose, etc. (“How does the blood circulatory system work?” | InformedHealth.org, 2019). We can divide the whole system in two portions: the systemic circulation which provides blood with all vital substances (e.g., oxygen, nutrients, hormones, etc.) to the organs, tissues and cells and the pulmonary circulation which allows oxygen entering the blood and the release of carbon dioxide (chemical reactions in the capillaries of the lungs). These two portions are complementary and unified by the blood pump of the body: the heart (“How does the blood circulatory system work?” | InformedHealth.org, 2019).
Mechanical Properties of Blood
In general, fluids can be categorized as either Newtonian or non-Newtonian. However, in some instances, there are fluids that can be difficult to properly categorize, such as blood, which displays properties of both fluid types. The definition of Newtonian fluid is a fluid in which, at every point, its viscous stress is linearly correlated to its shear rate. In other words, Newtonian fluids have a constant viscosity which is independent from the changes caused by shear rate.
Generally, a solution's viscosity determines the magnitude of resistance it experiences during flow. However, certain types of fluid do not possess a constant inner resistance. These fluids are called non-Newtonian. When analyzing the viscosity of these fluids under shear stress, it can be understood that they do not have a linear relationship (Chhabra, 2010). Instead, a derivative of the fluid's velocity profile can help explaining the relationship between fluid viscosity and shear stress. When velocity increases, the measure of the fluid viscosity does not increase at the same rate. Therefore, the shear stress applied on a non-Newtonian fluid is determined by this formula (“Fluid Mechanics | “The figure below is a device used to characterize viscosity of non-Newtonian…”” | Alex | YouTube, 2018):
τ= μ ×({du\over dy})^n(1)
where (τ) is the shear rate, (μ) is viscosity and (du/dy) is the derivative of the velocity profile.
Non-Newtonian Properties of Blood
As mentioned earlier, blood is mainly composed of plasma, which is an aqueous solution composed of proteins, ions and a suspension of cells. The far most frequent cells in the blood are erythrocytes, also called red blood cells. Typically, they can be found in concentrations of approximately 5 x 10⁶ cells/mm3 of blood. Other than erythrocytes, cells such as leukocytes – white blood cells – and platelets are also present in the plasma.
Plasma itself has a composition of liquid water (+ 90 %), other proteins such as fibrinogen, globulins, and albumin, and different types of ions (Woodcock, 1976). According to the experiments conducted by G. R. Cokelet et al., the plasma without any cell components results in a roughly linear relationship between viscosity and shear rate, which is typical for a Newtonian fluid. However, once the presence of the cells and other constituents – such as fibrinogen and suspended erythrocytes – are considered, the viscosity of the fluid now behaves in such a way as to qualify as a non-Newtonian fluid (Cokelet et al., 1963).
Even though white blood cells — leukocytes — and platelets are also present in plasma, they only contribute to a small portion of the cells and are considered negligible in affecting blood flow properties. Thus, this shear thinning behavior is mainly due to the presence of suspended red blood cells that are capable of aggregating and deforming their shape.
Red blood cells are mainly oxygen transporters with specific kinds of microrheological behaviors. They can make rheological transformations under different shear force environments. Depending on these changes, blood viscosity will increase or decrease regarding the shear rate, to exemplify blood's shear-thinning property (Chien, 1970). Under low strain rate conditions, red blood cell aggregation can be induced by various plasma proteins and the adhesion between cell membranes. The aggregated cells form groups called rouleaux (Barshtein et al., 2000; Chien, 1970). This phenomenon contributes to a higher flow resistance in the blood (Barshtein et al., 2000). In the experiment performed by Shu Chien in 1970, three groups of blood cell samples of comparable concentrations were contrasted: normal RBC (red blood cells) suspended in normal plasma, normal RBC suspended in albumin solution – where erythrocyte aggregation is prevented – and hardened RBC suspended in albumin solution – where both aggregation and deformation are prevented. The activity of each solution under different shear rates – from 0.1 sec-1 to around 1000 sec-1 – is observed (Fig. 5).
To continue, as a non-Newtonian fluid, blood possesses a viscoelastic property. This property is characterized by both viscosity and elasticity: the viscous properties of blood have more impact generally speaking. However, elasticity becomes the dominant factor under low shear conditions (Morris et al., 1987). At higher shear rates, the viscosity of blood decreases, meaning the blood thins; and at lower shear rates, the viscosity increases.
Even though white blood cells — leukocytes — and platelets are also present in plasma, they only contribute to a small portion of the cells and are considered negligible in affecting blood flow properties. Thus, this shear thinning behavior is mainly due to the presence of suspended red blood cells that are capable of aggregating and deforming their shape.
Red blood cells are mainly oxygen transporters with specific kinds of microrheological behaviors. They can make rheological transformations under different shear force environments. Depending on these changes, blood viscosity will increase or decrease regarding the shear rate, to exemplify blood's shear-thinning property (Chien, 1970). Under low strain rate conditions, red blood cell aggregation can be induced by various plasma proteins and the adhesion between cell membranes. The aggregated cells form groups called rouleaux (Barshtein et al., 2000; Chien, 1970). This phenomenon contributes to a higher flow resistance in the blood (Barshtein et al., 2000). In the experiment performed by Shu Chien in 1970, three groups of blood cell samples of comparable concentrations were contrasted: normal RBC (red blood cells) suspended in normal plasma, normal RBC suspended in albumin solution – where erythrocyte aggregation is prevented – and hardened RBC suspended in albumin solution – where both aggregation and deformation are prevented. The activity of each solution under different shear rates – from 0.1 sec-1 to around 1000 sec-1 – is observed (Fig. 5).
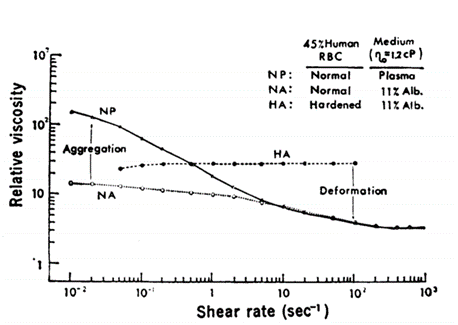
Under low shear rates, the normal suspension of red blood cells has the highest viscosity due to significant aggregation. Under a shear rate of 10 sec-1 to 50 sec-1, the normal RBC in the albumin solution results in a similar rheological activity as in the normal RBC solution, since a shear rate at 50 sec-1 is enough to disperse all forms of aggregation. After increasing the shear rate to 200 sec-1, the deformation of red blood cells occurs, leaving both solutions at low viscosity. As the hardened RBC solution does not process the ability to aggregate or deform, the viscosity of this solution remains approximately linear throughout the experiments. It can therefore be concluded that the change in the rheology of erythrocytes is one of the main causes for shear dependence of blood viscosity (Chien, 1970).
On the other hand, the deformation of erythrocytes also becomes a factor for the decrease in blood viscosity under high shear rates. When the hematocrit – volume percentage of red blood cells – of human blood is around 40 to 50 % and is undergoing shear rates of above 500 sec-1, the blood cells are often observed as dispersed, individual, elongated, deformed particles, where viscosity would be increased.
The rheology of red blood cells under such conditions can be described as an elongated flat ellipsoidal body (Fig. 6), where the cell continues to change shape and move within the flow. Assuming under conditions of low hematocrit – cell-cell interaction becomes negligible, when observing erythrocyte deformation, the orientation of the elongated cell is always pointed parallel to the direction of the flow. This phenomenon of deformation is due to shear stress transmittance from the cytoplasmic flow to the cell membrane. When the erythrocyte membrane is under the influence of a flow, it exhibits a tank-tread motion, in which the cell membrane is deformed, and the red blood cell can change its shape (Fischer et al., 1978).

This capacity is also particularly important during circulation, since red blood cells must be able to fold or deform to enter small capillaries as will be mentioned more precisely later. To prove further mechanisms of deformation, Fisher and his team conducted an experiment comparing red blood cell rheology under distinct levels of hematocrit and shear rate of flow. The result was as predicted: under higher shear rate, cells elongated and pointed in the flow direction. Furthermore, the elongation becomes more significant after increased hematocrit, suggesting that cell-cell interactions also favor the deformation process. This experiment also demonstrates the existence of another phenomenon: cytoplasmic shear flow, since the suspended marker has been seen moving inside the cytoplasm during experiment. This is due to the transmittance of the shear stress through the flexible membrane to the inner cytoplasmic fluid. This cytoplasmic shear flow is another phenomenon that favors cell deformation (Fischer et al., 1978). As the cell is aligned with shear flow, its elongated shape reduces the ratio between effective particle volume and true particle volume, and the disturbance of external streamlines decreases (Chien, 1970). Due to this effect, the inner friction – viscosity – of the blood also decreases.
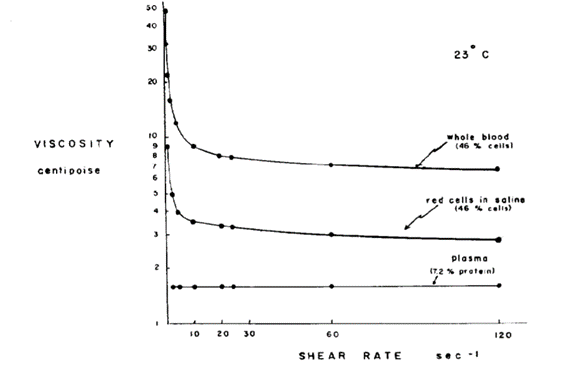
Through previous observations, blood viscosity is a shear-dependence result of the change in red blood cell aggregations and deformations under different shear rate conditions. However, red blood cell's rheological properties also vary according to the change in hematocrit and the presence of plasma proteins. One of the most important plasma proteins is fibrinogen. Fibrinogen has been studied and concluded as the main factor of red blood cell aggregation. The first person to work on this phenomenon was Wells Jr. and his team (Wells Jr. et al., 1962) when they studied blood behavior under near zero shear rate conditions and compared human blood viscosity to that of Ringer's solution – suspension of erythrocytes in saline solution). They discovered that the red blood cell suspension in Ringer's solution has significantly lower viscosity and the plot of shear stress/rate is similar to a linear function. As mentioned above, it acts more like a Newtonian fluid as its viscosity is nearly constant.
Therefore, the conclusion is there must exist one or more elements in human blood that causes the non-Newtonian property. Following studies have been carried out by Edward W. Merrill and his team focusing on the influence of fibrinogen and other plasma proteins on yield stress of blood. Yield stress is a measurement used to determine the maximum stress the blood can support without flowing (Merrill et al., “Yield stress of normal human blood”), distinguishing the blood's unique type of flow. When a stress is applied to the liquid, if it is lower than the yield stress, it can be considered as an elastic material which will be restrained from flowing. On the other hand, if the applied stress is higher than the yield stress, continuous flow will occur due to the viscous property of the liquid. The yield stress is accountable for the viscoelastic property of the fluid. The experiment focuses on the research of the element which is responsible for the yield stress of human blood flow. The team uses a “subtractive” approach, for which they remove different elements from the whole blood and observe every change after the process. Two of the results are important in this case: both the defibrinated blood solution and the suspension of erythrocytes in isotonic saline solution do not reveal any yield stress. In other words, the solutions act as Newtonian fluids, which diverges from expected human blood properties. Thus, the experiment concluded that fibrinogen is essential for human blood yield stress (Merrill et al., “Non-newtonian rheology of human blood-effect”). From these results, it can also be concluded that other types of plasma proteins may be important for creating a yield stress in blood flow; however, they have either no or less effect without the presence of fibrinogen (Merrill et al., “Blood rheology”).
Fibrinogen is a very important protein which is responsible for erythrocyte aggregation and deformation. Thus, its presence largely influences how blood behaves when at low hematocrit. However, the studies carried out by Shu Chien and his team in subsequent related experiments show that the presence of fibrinogen is no longer the primary factor for the non-Newtonian behaviors of human blood (Chien et al., 1966). Three solutions have been prepared for the experiment:
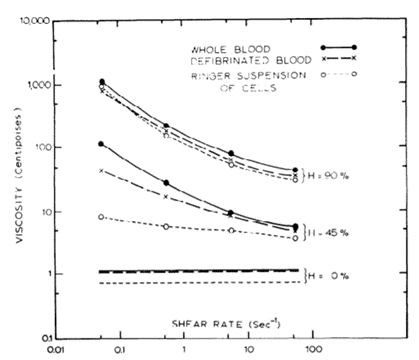
These solutions are measured for their different viscosity under different hematocrit (Fig. 8). For the defibrinated solution – below hematocrit of 15 % – and for the Ringer suspension of cells – below hematocrit of 30 % – the viscosity did not change substantially. Therefore, it means that, at low percentages of hematocrit, the presence and concentration of fibrinogen in blood is the main factor influencing the viscous properties of blood. However, when increasing the hematocrit of the two solutions, their viscosity starts to express high dependence on the shear rate, and when hematocrit is above 90 %, they show no different activity compared to the whole blood. Consequently, the solutions also express non-Newtonian properties (Chien et al., 1966). The results suggest that cell-cell interactions become more important at higher concentration of cells, and that the viscosity of the fluid becomes largely dependent from the hematocrit. To conclude, the influence of hematocrit on the non-Newtonian property of blood is also important to consider alongside the effects of fibrinogen.
Erythrocyte Deformability
Erythrocyte deformability is an important part of the mechanical aspect of this study and it greatly influences the function of blood. Red blood cells are characterized by a biconcave form (Elblbesy, 2018) and their capacity to adapt according to different vessel size is directly linked to several parameters that will be studied in the coming details. In addition, mammalian erythrocytes do not have nuclei(“40.2B: Red blood cells” | Biology LibreTexts, 2020) explaining their shape and making them more efficient at carrying oxygen due to a larger surface area.
The Mechanical Aspects of Erythrocyte Deformability
There are many examples of research surrounding erythrocyte deformability that have been led, including one spearheaded by Elblbesy which compares the behavior of two types of blood samples when faced to different degrees of shear stress (Elblbesy, 2018). One sample originated from healthy individuals and the other one originated from individuals living with anemia. The latter samples were from patients who suffer from a lack of iron that resulted in a lower capacity of their bodies to produce erythrocytes (Elblbesy, 2018). This means that oxygen is not efficiently carried and that cells are provided with less oxygen, reducing metabolism efficiency. Thus, less energy is synthesized, causing organismal issues – such as weakness and fatigue – associated with iron deficiency anemia. Consequently, by analyzing the difference in erythrocyte deformability, this research was able to explain what causes anemia to manifest.
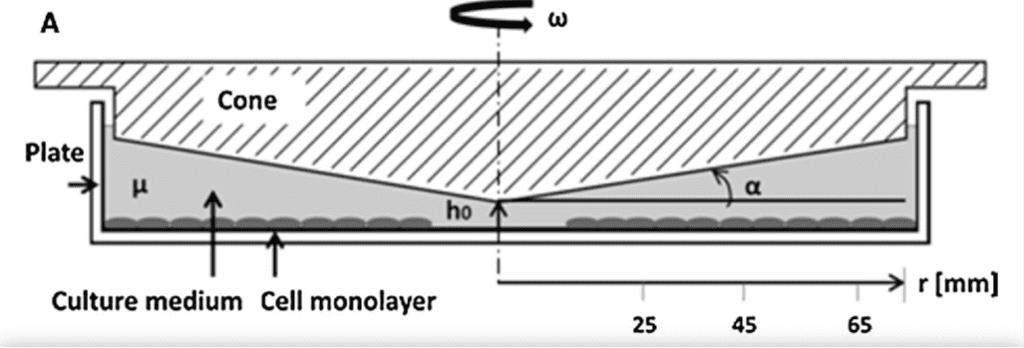
The method used for the experiment is the cone and plate flow system (Elblbesy, 2018). This material consists of a circular plate linked to a cone. The fluid is contained between these two elements and is being moved roundly by a rotation-based force commonly known in mechanics as torque(“Fluid Mechanics | “The figure below is a device used to characterize viscosity of non-Newtonian…”” | Alex | YouTube, 2018).
Before proceeding to the experiment explanation, it is key to be aware that blood is considered as being a non-Newtonian fluid and to consider the shear stress formula as mentioned in the previous section.
Velocity vectors are tangent to the plate lining and point in the direction of the cone rotation. In consequence, the graph that would represent the variation of velocity depending on the perpendicular distance between the center of the cone and the velocity vector will show a decreasing velocity while moving from the plate's lining to the plate's center. It is important to note, that the circular plate radius is a fundamental condition explaining the non-standardization of fluid velocity in the same container (“Fluid Mechanics | “The figure below is a device used to characterize viscosity of non-Newtonian…”” | Alex | YouTube, 2018). Moreover, velocity changes depending on the height of the container.
In this device, a volume of fluid resides between the surface of the plate and the cone whose peak is pointing towards the plate surface. Therefore, the velocity of the fluid will depend on the depth of this whole space that is not the same at different points of the system. This depth is most known as the height. As a result, it is important to consider that velocity will be maximal at a point placed in the highest position of the space. This will then decrease progressively from up to down. To better understand this concept, the stipulation that should be made is that when there is no rotation that is not triggering any fluid dynamism, the zero-velocity point is located at the corner of the plate where height is equal (“Fluid Mechanics | “The figure below is a device used to characterize viscosity of non-Newtonian…”” | Alex | YouTube, 2018).
The easiest way for modelling this experimental system is by schematizing it considering the side view. This way we could see the fluid container as a rectangular triangle with an angle that we will name θ. To calculate the radius of the circular plate it is obvious that trigonometric principles will be useful. The radius represents an adjacent side of the triangle (“Fluid Mechanics | “The figure below is a device used to characterize viscosity of non-Newtonian…”” | Alex | YouTube, 2018). The height (h) of the triangle is opposite to the angle θ. Thus, the tangent function seems to be the adaptable equation to find the value of the radius (r):
tanθ= {h\over r}(2)
r= {h\over tanθ}(3)
Then, by knowing that the angular velocity is expressed by this formula, it is possible to define the velocity (“Fluid Mechanics | “The figure below is a device used to characterize viscosity of non-Newtonian…”” | Alex | YouTube, 2018):
w= {v\over r}(4)
where w is the angular velocity, v is the linear velocity and r is the radius. Rearranging Eq. 4 to find v, we obtain the following equation:
v=r×w
(5)
As a result, the linear velocity could be expressed in terms of the constants h and tanθ as well as in terms of the angular velocity (“Fluid Mechanics | “The figure below is a device used to characterize viscosity of non-Newtonian…”” | Alex | YouTube, 2018):
v=u= {h\over tanθ}×w(6)
In summary, this explains that the shear stress formula is an essential parameter of the experiment and that it should be monitored precisely to allow accurate results (“Fluid Mechanics | “The figure below is a device used to characterize viscosity of non-Newtonian…”” | Alex | YouTube, 2018):
τ= μ×({du\over dy})^n=μ×{w\over tanθ}(7)
It is important to notice that the geometrical particularity of the device ensures that the shear stress applied on the fluid is the same in the entire container. Furthermore, the experience has been conducted at a constant room temperature of 25 degrees Celsius (“Fluid Mechanics | “The figure below is a device used to characterize viscosity of non-Newtonian…”” | Alex | YouTube, 2018).
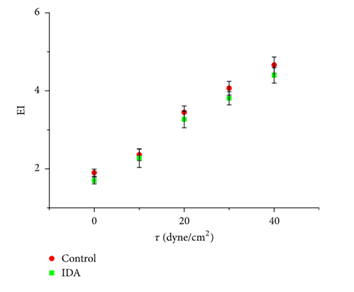
Erythrocytes' deformation, when exposed to different shear stress, was calculated by evaluating the elongation index (EI). That was made possible by analyzing two length measures known as the major axis length and the minor axis length (Elblbesy, 2018). The elongation index calculates the deformability of the erythrocytes according to the formula shown in Fig. 10.

The erythrocytes were acquired and the results of the experiment showed that for both erythrocytes coming from IDA patients and erythrocytes coming from healthy patients – control sample (Elblbesy, 2018), a change occurs in the EI value while the shear stress is increasing (Fig. 11). For both types of RBCs when shear stress becomes more consequential there is a notifiable deformity happening. This is translated by an increasing value for the elongation index. Consequently, this confirms that shear stress and deformability are linearly related as proven in the shear stress formula (Elblbesy, 2018). However, when the force applied on the fluid is rising, elongation index for erythrocytes from control samples is rising at a larger rate and more significantly than the elongation index of IDA. This difference in the ability of these two types of erythrocytes to get deformed is directly linked to anemia disease. Moreover, researchers noticed that the EI value gap between erythrocytes of control and IDA becomes larger (Elblbesy, 2018) starting from a precise shear stress of 30 dyne/cm2.
The deformations observed implied erythrocytes converting their solid physical state at a low shear stress to a “liquid drop” physical state at a higher shear stress (Elblbesy, 2018). When confronted to a strong shear stress erythrocytes take the form of an ellipsoid (Elblbesy, 2018).
In addition to the shear stress, other parameters control the ability of red blood cells to enter small capillaries. To evaluate these conditions, an experiment was performed by another team of researchers. They established a device that would allow the analysis of red blood cells' behavior when having to squeeze from a vessel of small radius to one even narrower. They varied different factors such as the rigidity, the cell volume and the surface area to volume ratio, commonly known as SA: V (Namvar et al., 2020).
Parameters Involved in Deformability
First, they examined how a change in red blood cells rigidity could affect other parameters such as the elongation index, the minimum cylindrical diameter, the IE and the SA: V that represent the surface taken by an RBC per unit of cell's volume. To do so, they monitored cells rigidity by injecting various quantities of glutaraldehyde substance. To approach elongation index, as explained earlier they confronted the cells with changing force of stress shear from 0 to 200 dyne/cm2. They observed that the changes in the cell volume, IE and SA: V were negligible. Thus, they conclude that rigidity would not be a decisive factor in giving erythrocytes the ability to change their shape to adapt to smaller vessels modelized here by channels (Namvar et al., 2020).
Secondly, researchers varied the cell volume parameter – the size taken by a red blood cell – to measure the erythrocyte capacity of deformability. To induce changes in the cell volume, the concentration of buffer solution was varied. The buffer solution in blood possesses a high importance since it maintains a constant blood pH. If its concentration and quantity are reduced, cells are less hydrated and vice-versa (Platt et al., 1981). The results showed that when the solubility of the buffer solution was decreased, in response, cells became more hydrated and thus their cell volume increased. This increase in cell volume would give a constraint to the deformability of the cell. In fact, cells experiencing a low buffer solution “osmolarity” would get stuck before entering the smaller vessel. In consequence, a higher cell volume would trigger the inability of erythrocytes to squeezethrough tiny capillaries (Namvar et al., 2020).
Thirdly, another experiment was set up to measure a potential importance of the SA: V value. For that, researchers decided to compare healthy erythrocytes with erythrocytes issued from P.knowlesi-infected (“plasmodium infection”) RBCs. As a result, the infected RBCs showed differences in the SA: V and EI values. Their surface per volume unit and their capacity to elongate were reduced compared to healthy erythrocytes. Additionally, the infected cells appeared to be less rigid than the cells modified with glutaraldehyde as mentioned earlier. Thus, this experience proved once again that cell's stiffness does not make the difference. Conversely, the measure of SA: V does (Namvar et al., 2020).
In summary, the deformation of erythrocytes depends on different parameters, especially those of SA: V and shear stress.

As shown in the shear stress formula, viscosity is also implied in the RBC deformation. An increase in the viscosity of the cytoplasm is linked with an increase in the mass of the hemoglobin protein. Consequently, the ability of erythrocytes to be deformed will be constrained (Kim et al., 2015).
Blood Flow in Capillaries
One of the main functions of blood is to carry nutrients such as oxygen and other dissolved components such as hormones and proteins throughout the body (Pries et al., 1996). It is the role of blood to give these constituents to tissue cells and, in exchange, take cell waste products such as carbon dioxide back through the circulatory system. The sites of these exchanges – capillary beds – are essential in the circulatory system and are made up of networks of many very small blood vessels (Rubenstein et al., 2015). These vessels, called capillaries, are merely one endothelial cell thick and allow for the diffusion of nutrients and waste between blood and the surrounding tissues (Rubenstein et al., 2015).
However, to make these exchanges possible, blood flow through the capillaries must be at a low enough rate to allow adequate time for proper diffusion to occur (Rubenstein et al., 2015). Thus, it is important to examine how the mechanical properties that have already been discussed determine blood flow through these tiny vessels.
In general, a relationship between horizontal flow, pressure and resistance of a fluid can be understood to be as follows (Secomb, 2016):
Q={ΔP\over R}(8)
where Q is the rate of flow of the fluid, ΔP is the pressure drop in the tube and R is the resistance of flow, assuming flow does not vary with time (Secomb, 2016). Essentially, the driving force of flow is a change in pressure (Rubenstein et al., 2015). This relationship also displays that rate of flow can be hindered by the presence of flow resistance.
Before examining this more closely, it is important to note which factors affect flow resistance in blood. We can look to Poiseuille's Law for fluid resistance in a tube for clarity (Secomb, 2016; Pries and Secomb, 2008).
R= {8ηl\over (ΔPπr^4)}(9)
This equation essentially states that resistance (R) is directly related to fluid viscosity (η) and tube length (l), and is indirectly related to the pressure drop (ΔP) and the radius of the tube (r) to the fourth power.
More importantly, however, is to consider how the resistance of blood flow in capillaries is influenced by the radius of the vessels. With diameters in the range of 5 to 20 μm, we can understand that capillaries are very narrow (Rubenstein et al., 2015). In Poiseuille's Law, resistance is inversely related to the radius to the fourth power. With small changes in radii, large changes in resistance can be measured. This means that in capillaries, where the tubes are very narrow, the most important factor to consider in flow resistance is the radius (Secomb, 2016; Pries and Secomb, 2008).
The two previous equations can be combined to form the more general Poiseuille's Law for flow in a cylindrical tube (Secomb, 2016; Pries and Secomb, 2008):
Q= {(ΔPπr^4)\over 8ηl}(10)
In this equation, the parameters remain the same as those already discussed. Poiseuille's law assumes that the flow does not vary with time and is laminar. The flow is also assumed to follow a Newtonian trajectory and that it has a fixed viscosity. The last assumption is that the tube has a uniform circular cross section (Pries and Secomb, 2008).
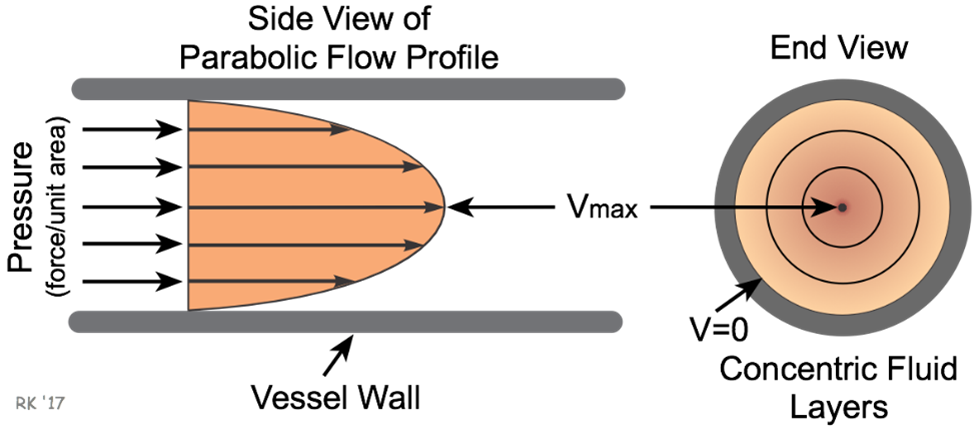
As it has already been discussed, depending on the conditions, blood may not satisfy these assumptions. Nevertheless, this law is a simplified approximation that adequately represents blood flow in capillaries (Pries and Secomb, 2008). In small vessels such as capillaries, the Reynold's number of blood flow is in the range of 10-3 to 1, which is in the laminar range, confirming this assumption (Pries and Secomb, 2008). This allows for the understanding that inertial forces are less important under these conditions than viscous forces (Secomb, 2016; Pries and Secomb, 2008). Blood will thus follow a parabolic velocity profile, where at the walls of the vessels the velocity will be zero whereas, at the centerline, the velocity will be maximized (Pries and Secomb, 2008) (Fig. 13).
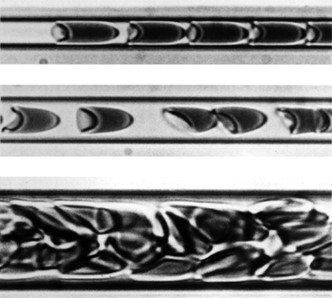
To continue in this new form, it is more clearly seen that laminar flow rate and tube radius are directly related. In terms of blood flow, as vessel radius decreases towards the size of those in capillaries, the rate of flow will also decrease (Pries et al., 1996). As identified previously, this is due to an increase in flow resistance. When red blood cells enter the capillaries, their diameter will approach the diameter of the entire vessel, causing the suspended cells to occupy most of the blood's velocity profile (Rubenstein et al., 2015). Due to the high resistance in these vessels, the blood cells will deform their shape to try and reduce resistance, forcing them to take a “bullet-like” form that clearly demonstrates a parabolic velocity profile (Fig. 14).
Challenges to Blood Flow
Due to the small size of capillaries, blood flow through these vessels is, at times, very difficult. The following analysis will discuss the challenges associated with accessing and sending blood through capillaries.
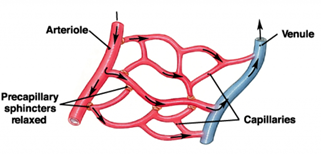
However, the radii of capillary entrances, called precapillary sphincters, are not always constant (Rubenstein et al., 2015). Capillaries do not have any substantial muscle tissue of themselves and instead rely on their junctions with the slightly wider metarterioles, which do have some muscle tissue, to regulate blood flow (Rubenstein et al., 2015). These precapillary sphincters contain muscle tissue which allows them to complete processes such as vasodilation, a widening of the sphincter, and vasoconstriction – a narrowing of the sphincter (Pries et al., 1996). These changes in precapillary sphincter radii can cause more flow or less flow resistance to occur at these junctions and therefore less blood flow or more blood flow through the capillaries (refer to Fig. 15).
Typically, the changes in precapillary sphincter size will be determined by the various needs of the body's tissues (Rubenstein et al., 2015). For example, if a tissue is becoming oxygen deficient, signals from the tissue cells will be received by the sphincter causing it to dilate (Rubenstein et al., 2015). This vasodilation will allow for an increased rate of flow into the capillary and thus more oxygen to be delivered to the tissue by the oxygenated blood cells.
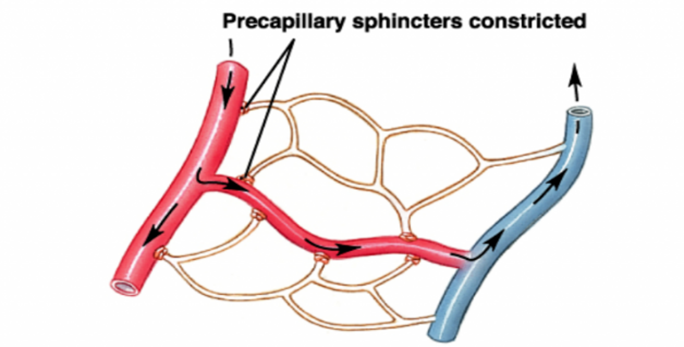
Alternatively, in another example, if an organism is experiencing heat loss in its extremities, the precapillary sphincters in these regions may be signalled to constrict. This would limit the blood flow through the capillaries in these regions and therefore conserve heat (Rubenstein et al., 2015).
Capillaries pose another challenge for blood perfusion as the vessels range from 5 to 20 µm in diameter, which in some cases may be smaller or roughly the same size as the diameter of individual blood cells (Rubenstein et al., 2015). To overcome this obstacle, blood cells rely on the elastic properties of their cytoskeleton to deform and fit into even the smallest of capillaries (Prothero and Burton, 1962). The properties of blood that allow these deformations will be discussed in more detail later.
Once inside capillaries, blood flow will occur typically one blood cell at a time (Prothero and Burton, 1962) as the vessel is too narrow for multiple blood cells – approximately 8 μm each in diameter (Pries and Secomb, 2008) – to traverse it at once. To ensure that the total blood flow through the organism remains constant, a very large quantity of capillaries is needed (Rubenstein et al., 2015).
Comparing Blood of Different Taxa
In comparison to reptilian and cephalopod red blood cells, mammalian erythrocytes do not have nuclei as previously mentioned. Depending on ecological advantages and circumstance, different species will have evolved different red blood cell physiology (refer to Fig. 16 and 17).
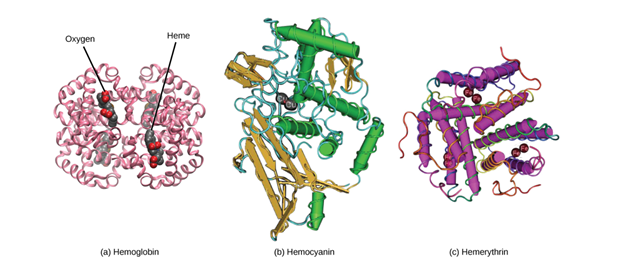
For example, cephalopods live in marine environments and include animals such as mollusks and octopuses. Researchers have observed that erythrocytes in cephalopods are present as a main component of blood and are all nucleated. Their blood cells do not rely on the oxygen carrier — hemoglobin — as the blood cells in humans do, but rather on another protein named hemocyanin, which gives their blood a blue color. Hemocyanin contains a copper element that is responsible for fixing of dioxygen.
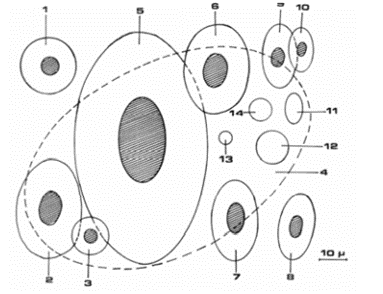
Moreover, red blood cells in reptiles also possess nuclei. However, compared to cephalopods, reptiles are characterized by another protein used to carry oxygen called hemerythrin (“Blood Cells” | Lumen Waymaker, n.d.). The advantage of nucleated red blood cells is that they can be used for mitosis. Mitosis can be defined as cellular reproduction. This cellular division is a more efficient way for red blood cell formation than in comparison to erythropoiesis for mammal erythrocytes formation happening in the bone marrow (Dzierzak and Philipsen, 2013).
However, hemerythrin does not include the chemical group function -heme, yet it is important in efficiency of oxygen carrying. In fact, denucleated erythrocytes, as present in mammals, do imply the fact that these red blood cells are involved in an anaerobic metabolism (“Blood Cells” | Lumen Waymaker, n.d.). The production of energy under the form of ATP is thus not requiring a reaction with the O2 molecule. Likewise, it is important to consider that, in addition to an absence of nuclei, mammalian red blood cells lack another organelle: mitochondria. Conversely, in cephalopod or reptilian erythrocytes synthesis, oxygen is required for the reaction, which reduces their efficiency in carrying an optimum quantity of oxygen (“Blood Cells” | Lumen Waymaker, n.d.).
Blood cells provide important information on the evolutionary biology of different species. For example, in 2015, scientists Sergio Bertazzo and Susie Maidment from the Imperial College London had made a discovery that revolutionized dinosaur studies. In fact, by analyzing a Cretaceous dinosaur bone fossil using the scanning electron microscope, they discovered the presence of what look like erythrocytes. Then, thanks to the focus ion beam device they were able to notice in depth the particularity of the red blood cells components. Results have shown an “internal structure” representing the nucleus and the amino acid sequence found was very similar to one present in the red blood cells of emus, an extant bird. This experiment confirmed this important structural difference between mammal erythrocytes and avian, reptile, erythrocytes (Tennant, 2015).
Conclusion
Blood is a complex fluid found in the circulatory system of organisms that is responsible for the delivery of oxygen, hormones and other essential elements throughout the body. Blood's shear-viscosity relationship can be described as a typical non-Newtonian fluid mainly due to erythrocytes capacity to deform. Its shear-viscosity relationship can be described as a typical non-Newtonian fluid mainly due to the capacity of erythrocytes to deform under different shear conditions. This ability also facilitates oxygen supply throughout the body despite different capillaries size as blood cells can deform to better travel through small vessels.
Researchers have compared healthy patients' red blood cells and IDA patients' red blood cells allowing to better understand the structural particularities of erythrocytes and the necessary parameters – such as SA: V, cell volume – that would determine this deformability. When considering blood flow, it is also important to recognize how the circulatory system impacts oxygen delivery, especially in small vessels such as capillaries where the nutrients carried by blood will come into contact with tissues.
The efficiency of mammalian erythrocytes to carry oxygen throughout the body results from a species-specific evolution that allows for optimal operation under environmental conditions. The blood of animals, such as cephalopods and reptiles, is characterized by nucleated erythrocytes containing two other proteins that are structurally different from hemoglobin, resulting in a different function.
Appendix
“Fluid Mechanics | “The figure below is a device used to characterize viscosity of non-Newtonian…”.”, 8 March 2018, Alex, YouTube, https://www.youtube.com/watch?v=NuRojnXyQPk.
“The Composition and Function of Blood.”, 28 March 2019, Professor Dave Explains, YouTube, https://www.youtube.com/watch?v=yj7bfZKlIp8.
References
Arikan, H., & Çiçek, K. (2014). Haematology of amphibians and reptiles: a review. North-Western Journal of Zoology, 10(1), 20. Retrieved from http://biozoojournals.ro/nwjz/content/v10n1/nwjz_143501_Cicek.pdf
Ballermann, B. J., Dardik, A., Eng, E., & Liu, A. (1998). Shear stress and the endothelium. Kidney International, 54, S100-S108. doi:10.1046/j.1523-1755.1998.06720.x
Barshtein, G., Wajnblum, D., & Yedgar, S. (2000). Kinetics of Linear Rouleaux Formation Studied by Visual Monitoring of Red Cell Dynamic Organization. Biophysical Journal, 78(5), 2470-2474. doi:10.1016/S0006-3495(00)76791-9
Britannica, E. (2014). blood diagram. In: Encyclopedia Britannica. Retrieved from https://www.britannica.com/science/blood-biochemistry#/media/1/69685/113906
Chhabra, R. P. (2010). Non-Newtonian Fluids: An Introduction. In J. M. Krishnan, A. P. Deshpande, & P. B. S. Kumar (Eds.), Rheology of Complex Fluids (pp. 3-34). New York, NY: Springer New York.
Chien, S. (1970). Shear dependence of effective cell volume as a determinant of blood viscosity. Science, 168(3934), 977-979. doi:10.1126/science.168.3934.977
Chien, S., Usami, S., Taylor, H. M., Lundberg, J. L., & Gregersen, M. I. (1966). Effects of hematocrit and plasma proteins on human blood rheology at low shear rates. Journal of Applied Physiology, 21(1), 81-87. doi:10.1152/jappl.1966.21.1.81
Cohn, L., Hawrylowicz, C., & Ray, A. (2014). 12 – Biology of Lymphocytes. In N. F. Adkinson, B. S. Bochner, A. W. Burks, W. W. Busse, S. T. Holgate, R. F. Lemanske, & R. E. O'Hehir (Eds.), Middleton's Allergy (Eighth Edition) (pp. 203-214). London: W.B. Saunders.
Cokelet, G. R., Merrill, E. W., Gilliland, E. R., Shin, H., Britten, A., & Jr., R. E. W. (1963). The Rheology of Human Blood—Measurement Near and at Zero Shear Rate. Transactions of the Society of Rheology, 7(1), 303-317. doi:10.1122/1.548959
Dzierzak, E., & Philipsen, S. (2013). Erythropoiesis: development and differentiation. Cold Spring Harbor Perspectives in Medicine, 3(4), a011601. doi:10.1101/cshperspect.a011601
Elblbesy, M. A. (2018). Microscopic Monitoring of Erythrocytes Deformation under Different Shear Stresses Using Computerized Cone and Plate Flow Chamber: Analytical Study of Normal Erythrocytes and Iron Deficiency Anemia. BioMed Research International, 2018, 6067583. doi:10.1155/2018/6067583
Fischer, T. M., Stöhr-Lissen, M., & Schmid-Schönbein, H. (1978). The red cell as a fluid droplet: tank tread-like motion of the human erythrocyte membrane in shear flow. Science, 202(4370), 894-896. doi:10.1126/science.715448
Franzoni, M., Cattaneo, I., Ene-Iordache, B., Oldani, A., Righettini, P., & Remuzzi, A. (2016). Design of a cone-and-plate device for controlled realistic shear stress stimulation on endothelial cell monolayers. Cytotechnology, 68(5), 1885-1896. doi:10.1007/s10616-015-9941-2
greek.doctor. (2020). 35. Circulation through the capillaries. Retrieved from https://greek.doctor/second-year/physiology-1/25-circulation-through-the-capillaries/
Gupta, J. I., & Shea, M. J. (2019, Apr 2019). Biology of the Blood Vessels. Retrieved from https://www.msdmanuals.com/home/heart-and-blood-vessel-disorders/biology-of-the-heart-and-blood-vessels/biology-of-the-blood-vessels
HealthEngine. (2019). Blood function and composition. Retrieved from https://healthengine.com.au/info/blood-function-composition#C10
Horiba. (n.d.). Blood plasma. Retrieved from https://www.horiba.com/en_en/technology/measured-and-controlled-objects/liquid/blood-plasma/
InformedHealth.org. (2019). How does the blood circulatory system work? In. Retrieved from https://www.ncbi.nlm.nih.gov/books/NBK279250/#!po=16.6667
Jr., R. E. W., Merrill, E. W., & Gabelnick, H. (1962). Shear‐Rate Dependence of Viscosity of Blood: Interaction of Red Cells and Plasma Proteins. Transactions of the Society of Rheology, 6(1), 19-24. doi:10.1122/1.548912
Kim, J., Lee, H., & Shin, S. (2015). Advances in the measurement of red blood cell deformability: A brief review. Journal of Cellular Biotechnology, 1(1), 63-79. doi:10.3233/JCB-15007
Klabunde, R. E. (2018). Laminar Flow. Retrieved from https://www.cvphysiology.com/Hemodynamics/H006
LibreTexts, B. (2020). 40.2B: Red Blood Cells. In General Biology (Boundless). Retrieved from https://bio.libretexts.org/Bookshelves/Introductory_and_General_Biology/Book%3A_General_Biology_(Boundless)/40%3A_The_Circulatory_System/40.2%3A_Components_of_the_Blood/40.2B%3A__Red_Blood_Cells
Mechatronics, R. (n.d.). Lorrca. Retrieved from https://rrmechatronics.com/product/rbc-2/lorrca/
Merrill, E. W., Cheng, C. S., & Pelletier, G. A. (1969). Yield stress of normal human blood as a function of endogenous fibrinogen. Journal of Applied Physiology, 26(1), 1-3. doi:10.1152/jappl.1969.26.1.1
MERRILL, E. W., COKELET, G. C., BRITTEN, A., & WELLS, R. E. (1963). Non-Newtonian Rheology of Human Blood – Effect of Fibrinogen Deduced by “Subtraction”. Circulation Research, 13(1), 48-55. doi:doi:10.1161/01.RES.13.1.48
Merrill, E. W., Gilliland, E. R., Lee, T. S., & Salzman, E. W. (1966). Blood Rheology: Effect of Fibrinogen Deduced by Addition. Circulation Research, 18(4), 437-446. doi:doi:10.1161/01.RES.18.4.437
Morris, C. L., Smith, C. M., & Blackshear, P. L. (1987). A new method for measuring the yield stress in thin layers of sedimenting blood. Biophysical Journal, 52(2), 229-240. doi:10.1016/S0006-3495(87)83210-1
Namvar, A., Blanch, A. J., Dixon, M. W., Carmo, O. M. S., Liu, B., Tiash, S., . . . Tilley, L. (2020). Surface area-to-volume ratio, not cellular viscoelasticity, is the major determinant of red blood cell traversal through small channels. Cellular Microbiology, 23(1), e13270. doi:10.1111/cmi.13270
OpenStax. (2012). 40.2 Components of the Blood. In OpenStax (Ed.). C. Biology (Series Ed.), Biology.
Platt, O. S., Lux, S. E., & Nathan, D. G. (1981). Exercise-induced hemolysis in xerocytosis. Erythrocyte dehydration and shear sensitivity. Journal of Clinical Investigation, 68(3), 631-638. doi:10.1172/jci110297
Pries, A. R., & Secomb, T. W. (2008). Blood Flow in Microvascular Networks. In Microcirculation (pp. 336): Elsevier Inc.
Pries, A. R., Secomb, T. W., & Gaehtgens, P. (1996). Biophysical aspects of blood flow in the microvasculature1. Cardiovascular Research, 32(4), 654-667. doi:10.1016/s0008-6363(96)00065-x
Prothero, J. W., & Burton, A. C. (1962). The physics of blood flow in capillaries. III. The pressure required to deform erythrocytes in acid-citrate-dextrose. Biophysical Journal, 2(2 Pt 1), 213-222. doi:10.1016/s0006-3495(62)86850-7
Rubenstein, D. A., Yin, W., & Frame, M. D. (2015). Chapter 6 – Microvascular Beds. In D. A. Rubenstein, W. Yin, & M. D. Frame (Eds.), Biofluid Mechanics (Second Edition) (pp. 227-266). Boston: Academic Press.
Secomb, T. W. (2016). Hemodynamics. Compr Physiol, 6(2), 975-1003. doi:10.1002/cphy.c150038
Tennant, J. (2015). 75 Million-Year-Old Blood Cells Discovered in Dinosaur Bones. Retrieved from https://www.discovermagazine.com/planet-earth/75-million-year-old-blood-cells-discovered-in-dinosaur-bones
Waymaker, L. (n.d.). Blood Cells. Retrieved from https://courses.lumenlearning.com/wm-biology2/chapter/blood-cells/ Woodcock, J. P. (1976). Physical properties of blood and their influence on blood-flow measurement. Reports on Progress in Physics, 39(1), 65-127. doi:10.1088/0034-4885/39/1/002