The Heart: Information and Storage Processing
Anne-Sarah Dickman, Lina El Kesti, Junqi Wang, Angela Zhu
Introduction
We start by providing a general overview of the cardiac conduction system, beginning with the circuit the electric signal takes through the heart and then focusing in on specific cells. Such a complex cardiac conduction system is only fully present in mammals.
We will then cover the signal conduction process and the corresponding images shown on an electrocardiogram (ECG). We discuss the evolutionary adaptations from reptiles to birds and mammals that are reflected on the ECG appearances.
Electrical circuit disruptions are elaborated by examining different arrhythmogenic factors such as ion channel remodeling, reduced excitability, calcium cycling, decreased intercellular electrical coupling, scar tissue and the reentry mechanism. Different heart blocks and their interpretation on an ECG, as well as ectopic foci are explored.
The use of numerical and computational models will be discussed to explore the electrical activity of the heart. Further, the role of fiber orientation will be examined with respect to cardiac electrical propagation.
General Overview
The mammalian heart is made of two types of cells: contractile cardiomyocytes and conductive cardiomyocytes (Betts et al., “Cardiac Muscle and Electrical Activity”). The former provide the mechanical force behind the contractions of the heart and the latter generate the electric impulse that sets off each contraction (Betts et al., “Cardiac Muscle and Electrical Activity”). The conductive cells form the pacemaker cells, nodes, and the conducting pathway. They have automaticity, that is, unlike other cells, they can generate their own action potential without any outside stimuli (Ikonnikov and Yelle, n.d.). The conducting system as a whole is responsible for initiating each heartbeat, spreading the electric signal, and maintaining the rhythm.
Conducting System of the Heart
Briefly, the electric system of the heart is as follows. To start with, the cell which has the fastest beating rhythm sets the pace for all the other cells (Betts et al., “Cardiac Muscle and Electrical Activity”). In this case, the sinoatrial (SA) node has this role. Having automaticity, it generates an electric potential which spreads to neighboring contractile cells as well as to the conducting pathways (refer to Desai, “Electrical system of the heart” in Appendix). These pathways conduct the signal faster than contractile cells. Bachmann's bundle brings the signal to the left atrium while the anterior, middle, and posterior tract leads to the atrioventricular (AV) node (Laske and Iaizzo, 2005). The signal then continues to the ventricles through the Bundle of His, fascicles and Purkinje's fibers (refer to Desai, “Electrical system of the heart” in Appendix).

Before examining cells, it is important to note that the membrane potential is defined as the difference in charge between the internal and external environments of the cell (Ikonnikov and Yelle, n.d.). Ion channels allow specific ions to flow in and out. In the case of cardiac cells, these ion channels are voltage-gated, that is, they open and close at specific membrane potential voltages (Ikonnikov and Yelle, n.d.).
Conductive Cells
As previously stated, the AV node, the SA nodes and the conductive pathways are made of conductive cells and their membrane potential cycle is as follows.
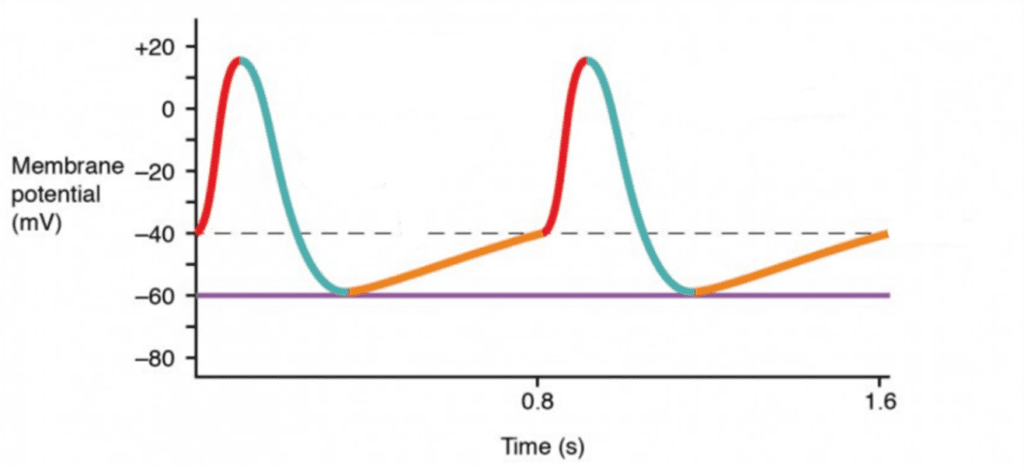
- At – 40 mV, calcium ion channels open, thereby allowing calcium to flow in. Since Ca2+ has an equilibrium potential superior to +100 mV, the cell will depolarize, that is, its charge will become positive (Ramahi and Ruff, 2014; refer to Desai, “Action potentials in pacemaker cells” in Appendix). This is shown in red in Fig. 2.
- Once it reaches around +10 mV, these calcium channels close while potassium channels open (refer to Desai, “Action potentials in pacemaker cells” in Appendix). Potassium has an equilibrium potential of –105 mV (Ramahi and Ruff, 2014). Consequently, the charge decreases as shown in blue.
- At – 60 mV, potassium channels close (refer to Desai, “Action potentials in pacemaker cells” in Appendix). However, the cell membrane is permeable to sodium which has an equilibrium charge of +65 mV (Ramahi and Ruff, 2014). The charge will then slowly rise, as shown in orange, until it reaches the threshold at – 40mV and the cycle resumes (refer to Desai, “Action potentials in pacemaker cells” in Appendix). Consequently, no external stimuli are needed to restart the cycle.
Contractile Cells
Electric signals which are transmitted from cell to cell through gap junctions create an action potential which leads to cell contraction (Ikonnikov and Yelle, n.d.). The steps are as follows.

- The resting potential of a contractile cardiomyocyte is – 90 mV. As the neighboring cell depolarizes, the membrane potential becomes more and more positive as Na+ and Ca2+ leak in through gap junctions and sodium channels start to open (refer to Desai, “Action potentials in cardiac myocytes” in Appendix).
- The cell starts depolarizing rapidly (at step 0) and as it becomes positive, sodium channels close and potassium channels open, resulting in a decrease in membrane potential as shown in step 1 (refer to Desai, “Action potentials in cardiac myocytes” in Appendix).
- The stabilization at step two is due to the opening of calcium channels. This plateau serves to prevent premature contraction. As a result, this step takes about 175ms while the entire cycle takes about 250 to 300 ms (Betts et al., “Cardiac Muscle and Electrical Activity”).
- At around 0 mV, the calcium channels would close, and the cell will depolarize until it reaches – 90 mV, when the potassium channel will close. The membrane potential will remain at – 90 mV until the SA node sends out the next electrical signal (refer to Desai, “Action potentials in cardiac myocytes” in Appendix).
A cardiac conduction system made of “pacemaker nodes, specially coupled cardiomyocytes and a fast conduction system enabling coordinated, sequential contraction of the chambered heart” as the one previously examined is only found in warm-blooded animals such as mammals and birds (Burkhard et al., 2017; Šolc, 2007).
Invertebrates, for example, seldom possess a coordinated pumping system. Tunicates, for instance, have an open vascular system and a tubular heart. Interestingly, they possess cells which are electrically coupled with each other and which possess automaticity, similar to mammals. However, there is no dominant pacemaker. Instead, random cells become dominant arbitrarily, resulting in the “bloodstream direction varying over time,” thereby highlighting the importance of the SA node (Šolc, 2007).
Cephalochordates on the other hand, have a closed circulatory system but no heart. Instead, blood vessels act as pumps. However, they have no pace-making cells, resulting in bad coordination and “countercurrent contractions and flow” (Šolc, 2007).
Unfortunately, the reason behind the acquisition of such an intricate conduction system throughout evolution is unknown. It is, however, hypothesized that a pacemaker system renders the heart more efficient and powerful, thereby capable of sustaining a higher metabolic rate (Burkhard et al., 2017).
Conduction System and Electrocardiogram
A heart maintains its ability of generating electrical impulses through the conduction system which includes SA node, the AV node, the atrioventricular bundle, and the Purkinje cells. The atrioventricular bundle, also called bundle of His, starts from the AV node and divides into right and left bundle branches, connecting the right and left ventricles separately. Purkinje fibers are at the end of the two branches and are responsible for spreading the impulse to the myocardial contractile cells in the ventricles (Betts et al., “Cardiac Muscle and Electrical Activity”).
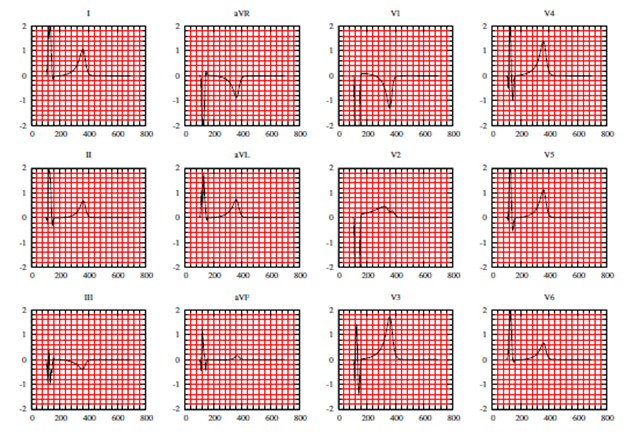
Electrocardiogram is the tracing of electrical signals provided by heart electrical activities. It has been a very important clinical tool for determining both normal and abnormal heart functions. A general human ECG is most standardized and well corresponded to the heart activities in a full cardiac cycle (Boukens et al., 2019).
As the blood from veins enter the atrium, a pressure gradient forms between the atrium and the ventricle, which leads most blood passively to the ventricle without contracting the atrium. As about 70 – 80 % of blood enters the ventricles, the SA node will send signals to both atria to contract, which pushes rest of the blood to the ventricle. Such a stage is called atrial systole and is labeled as P wave on the ECG ( A heart maintains its ability of generating electrical impulses through the conduction system which includes SA node, the AV node, the atrioventricular bundle, and the Purkinje cells. The atrioventricular bundle, also called bundle of His, starts from the AV node and divides into right and left bundle branches, connecting the right and left ventricles separately. Purkinje fibers are at the end of the two branches and are responsible for spreading the impulse to the myocardial contractile cells in the ventricles (Betts et al., “Cardiac Muscle and Electrical Activity”). Then the signal from SA node reaches the AV node, located between the left and right atrium, where the signal is delayed about 0.1 sec before getting to the heart apex. Such a delay is to make sure the atria are empty completely and is marked as a horizontal line between P and Q on the ECG. Following the delay, the impulse travels through the atrioventricular bundle and bundle branches to the Purkinje fibers and triggers the ventricular systole. The ventricles contracts so strongly that it forces open the pulmonary and aortic semilunar valves and the blood enters the aorta and pulmonary trunk. This stage is denoted by the QPS peak on the ECG. The last stage is ventricular diastole. The ventricles relax and the pressure on ventricles drop even lower than the atria. The blood flow into the atria from the veins, pushing open the tricuspid and mitral valves. This stage is denoted as T wave on the ECG. The total time elapsed from the initiation of the impulse in the SA node until depolarization of the ventricles is approximately 225 ms ( A heart maintains its ability of generating electrical impulses through the conduction system which includes SA node, the AV node, the atrioventricular bundle, and the Purkinje cells. The atrioventricular bundle, also called bundle of His, starts from the AV node and divides into right and left bundle branches, connecting the right and left ventricles separately. Purkinje fibers are at the end of the two branches and are responsible for spreading the impulse to the myocardial contractile cells in the ventricles (Betts et al., “Cardiac Muscle and Electrical Activity”).

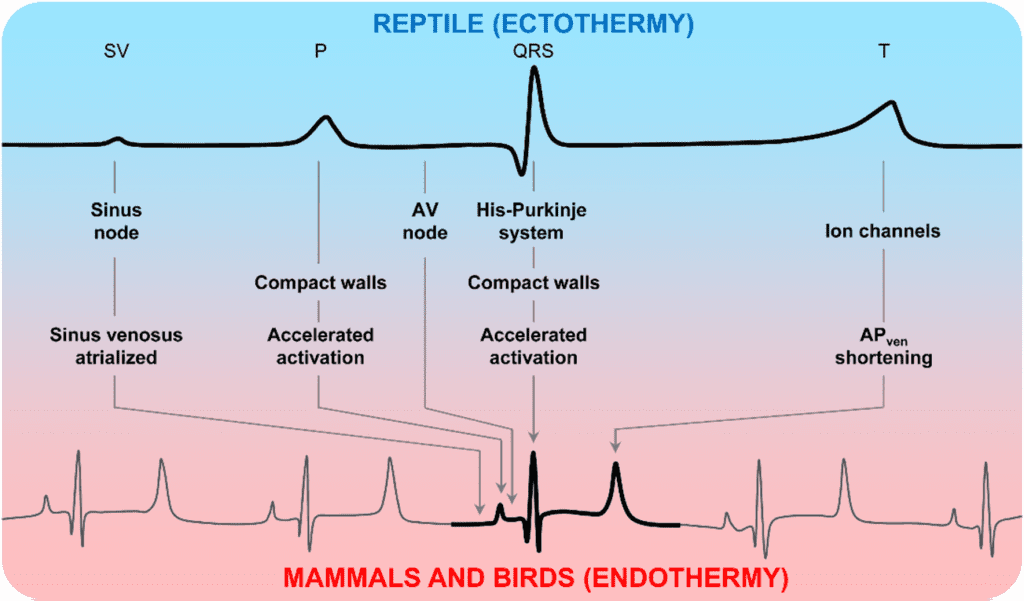
Although ECG functions very importantly in clinical aspects, it is not the focus of our paper. Instead, we would like to introduce differences between reptile ECG and mammalian ECG diagrams. Reptiles, known as ectothermic, have a much lower heart rates than endothermic mammals, and this difference is reflected as longer lengths of intervals on ECGs. The duration of the P wave and QRS complex is larger in ectotherms compared to mammals and birds, and the PR interval was more than 5-fold longer in the ectotherms than in the endotherms (Boukens et al., 2019).
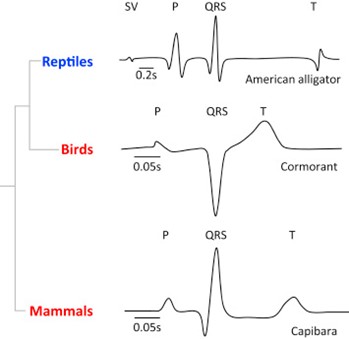
The comparison of intervals is associated with a short atrial and ventricular activation time, a substantial shortening of the atrioventricular delay, and a short ventricular action potential. The shortening of the QRS and the P durations may be explained by the presence of a conduction system in the ventricle of mammal and bird's heart, which is very important in the faster ventricular activation in mammals (Kaese et al., 2013). The development of the tissue architecture may also help to explain the duration differences. The ventricular wall in endotherms is quite compact and with few trabeculations (non-compaction pieces of muscle that will extent into chambers), allowing faster filling and emptying in endothermic hearts (Boukens et al., 2019).
In summary, the main evolutionary cardiac adaptions as revealed by ECGs including the shortening in the endotherms of the QRS and PR interval is a result of many factors such as temperature, presence of conduction system, and tissue architecture (Boukens et al., 2019).
Electrical Circuit Disruptions
Heart Blocks
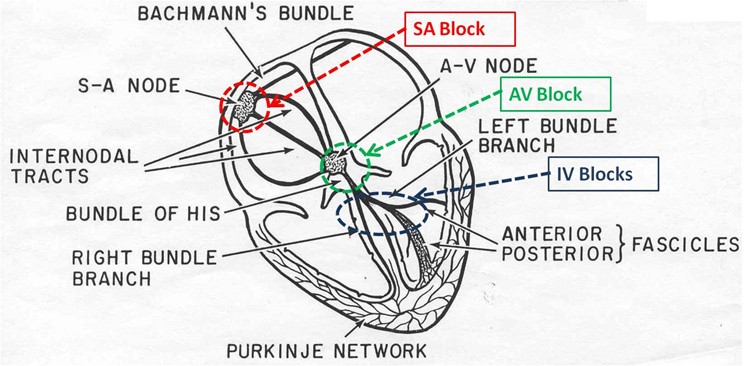
A heart block is defined as an “interruption in the normal conduction pathway” (Betts et al., “Cardiac Muscle and Electrical Activity”). Nomenclature is simple: when the block occurs in the SA node, it is an SA nodal block, when it occurs in the AV node, it is an AV nodal block, when it occurs in the bundle of His it is an infra-Hisian block and when it occurs in the atrioventricular bundle branches it is called a bundle block.
The most common are AV nodal and infra-Hisian blocks. AV blocks have multiple degrees. A detailed interpretation of an electrocardiogram will follow in another section of this essay, but certain patterns will be mentioned in order to explain the difference between degrees of AV blocks. A delay in conduction between the SA nodes and the AV nodes is considered a first-degree or partial block and can be seen on an ECG as a longer PR interval, which represents the time difference between the onset of atrial and ventricular depolarization. An incomplete or second-degree block refers to a situation in which certain impulses from the SA node make it to the AV node, while certain do not. This would result in certain P waves that are not followed by a QRS complex and certain that are on an ECG. A third-degree or complete block is when there is absolutely no interconnection between atrial activity and ventricular activity, so there is no connection between the P wave and the QRS complex on an ECG (Betts et al., “Cardiac Muscle and Electrical Activity”).
AV nodal blocks are different to SA nodal blocks because if a total SA block was to occur, the AV node would take over as pacemaker and initiate enough contractions per minute to keep a mammal conscious. In this situation, an artificial pacemaker that would deliver electrical impulses to the heart would be needed in order to stimulate contractions increase the heart rate (Betts et al., “Cardiac Muscle and Electrical Activity”).
Ectopic Foci
In certain cases, it is possible for an area other than the SA node to initiate an impulse that can cause a premature contraction. This area is referred to as an ectopic focus. It can either be a part of the conduction system or it can be from other contractile cells. Stimulation from exposure to medication or caffeine, in humans, or divisions of the autonomic nervous system or diseases in other species can initiate an ectopic focus (Betts et al., “Cardiac Muscle and Electrical Activity”).
Occasional ectopic foci stimulations are not harmful because they can be overridden by higher SA nodal rates, but chronic stimulation of the ectopic foci can cause fatal disruptions of the electrical circuit of the heart by adding additional beats or eventually taking over the normal SA pacemaker activity. In the case of a third-degree or complete AV nodal block, there can still be ventricular rhythm because of the presence of ectopic foci. The ectopic ventricular pacemakers only produce a heart rate of 30-40 beats per minute, which is much less that the normal 60-100 beats per minute of a normal heart (Klabunde, “Ectopic Foci”).
In the case that the ectopic foci override the SA nodal rhythm, depolarization is greatly affected and takes longer to spread through the myocardium tissue, meaning the ventricle will be depolarized much slower. This is visible on an ECG by a QRS complex that changes shape and has a greater duration than normal (Klabunde, “Ectopic Foci”).
Cardiac Electrophysiology and Numerical Models
Cardiac Electrophysiology
Cardiac electrophysiology is the study of electrical activities within the heart. This science relies on observations and studies of arrhythmia mechanisms using models of animals, with a focus on evaluating the symptoms and ways on how to treat them. In fact, animal models have highly contributed to the understanding of many diseases and their diagnosis, as well as proving the efficiency or not of certain remedies and therapeutic approaches (Chorro et al., 2009). By having control over many variables and factors in these models, the information obtained is very precise and specific, and can later be applied to human pathology for instance. Usually, the experimental models stem from research and experimentation based on isolated cells or tissues. For example, many models of cardiovascular diseases and conditions have been developed as a result of spontaneous genetic mutations and/ or specific genomic modification (i.e., gene transfer) in small mammals. In larger animals, experimental models are developed to study physiological regulatory and homeostatic mechanisms (Chorro et al., 2009).
Even though presenting animal models would be beneficial to the understanding of cardiac conditions, that is not the focus of this section. Instead, we can look at ways on how to numerically model and simulate heart electrophysiology. Indeed, a mathematical model of cardiac electrophysiology further helps understand the biological mechanisms in the heart, particularly if the heart is subject to certain pathological and/ or physiological conditions. During recent years, numerical simulations and mathematical modeling was extensively used to solve and simplify problems in various domains such as science and engineering. It is important to model the electrical activity of the heart to better understand the aforementioned conditions and diseases, which can sometimes be lethal. If we want to take direct measurements of the electrical activity in the heart, we will only receive signals from its surface. We will not know where the activity is precisely coming from. However, by using computer simulations, we can analyze what happens at the surface of the heart but also inside the myocardium. Then, we can link what we observe to the electrochemical behavior of heart cells in order to get to the core of the problem, if it exists (Mena and Bea, 2019). In addition, these simulations allow us to access physical quantities (e.g., local stress values in the cardiac tissue, certain volumes, ECGs) that cannot be measured. This is important as such quantities are medical indicators which allow doctors to further understand and assess a pathology and predict the way in which it will evolve (Chapelle et al., 2009).
Modeling the Electrical Activity of the Heart
There are many advantages to the numerical simulation and mathematical modeling of the electric activity of the heart. As seen previously when the heart's architecture was discussed, the heart is structurally complex due to different configurations of heart tissue and collagen. So, it is necessary to consider the complex behavior of cardiac cells when studying the electrical properties of the heart. This behavior can be simulated using different models, notably the bidomain and monodomain models. Both use a method which integrates physical and anatomical models (Chapelle et al., 2009).
Bidomain Model
An implantable cardiac pacemaker has been developed during the past century and consists today of one of the most important innovations in engineering and medicine. However, the mechanisms behind the functioning of pacemaker cells and the way they fired action potentials was not fully understood until very recently. The bidomain model, which describes the electrical properties of heart tissue, helped discover these mechanisms (Janks and Roth, 2009) and consisted in a real breakthrough.
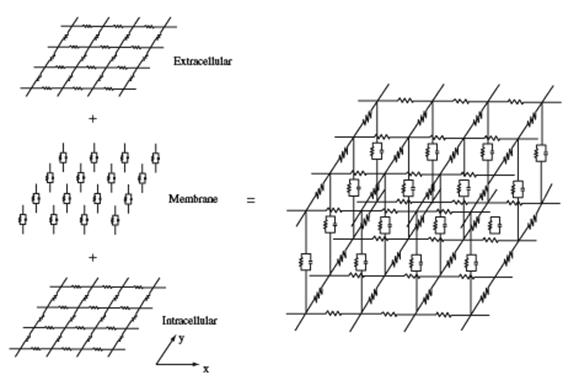
This model describes the electrical coupling of cardiomyocytes and conduction through ventricles by modeling cardiac tissue as a “multidimensional cable that can be represented by a network of resistors and capacitors” (Janks and Roth, 2009). Heart tissue is modeled by two continuous domains: intracellular and extracellular. Both domains play the role of a volume conductor and have different conductivity tensors and potentials. The ionic currents which circulate in the heart are displaced from one domain to another via the cell membrane, which acts as a condenser (Mena and Bea, 2019).
In Fig. 9, the lower and upper grids represent resistors which model the intracellular and extracellular space of cardiac tissue. The membrane is made up of capacitors forming a condenser. We can recall that one of the properties of heart tissue was anisotropy; this means that resistors parallel to the x-axis are not identical to the resistors parallel to the y-axis. The degree of anisotropy changes when we compare the intracellular and extracellular spaces; usually, the intracellular space is more anisotropic due to the ratio of conductivity in x and y directions. It is close to two in the extracellular space and about ten in the intracellular space (Janks and Roth, 2009). The resistors represent the ion channels while the capacitors represent the capacitive current in the cell membrane (Ibrahim et al., 2013). These different anisotropy ratios are at the core of electrical properties in the heart which are studied through the bidomain model (Janks and Roth, 2009).
Mathematically, the cardiac tissue is modeled by two continuous domains which represent the intracellular and extracellular domains. First, we can represent the currents in both domains by applying Ohm's Law:
J_i=-M_i ∇V_i
(1)
J_e=-M_e ∇V_e
(2)
where Ji is the intracellular current, Je is the extracellular current, Mi and Me are the conductivity tensors, and Vi and Ve are the intracellular and extracellular potentials (Mena and Bea, 2019). Indeed, the bidomain model represents the tissue as a two-phase (intracellular and extracellular) ohmic conducting medium (Ibrahim et al., 2013).
The cell membrane acts as a condenser. Since it is thin, the charge stored on one side of the condenser is instantaneously compensated on the other side. Therefore, the charge is zero everywhere:
{∂\over ∂t} (q_i+q_e )=0 (3)
where qi and qe are the charges in the intracellular and extracellular space (Mena and Bea, 2019).
We can now represent the flow of current in a point. It is equal to the rate of accumulation of charge (Eq. 3) and the ionic current that is going outside the point:
-∇\sdot J_i= {∂q_i\over ∂t}+ χJ_{ion}(4)
-∇\sdot J_e= {∂q_e\over ∂t}- χJ_{ion}(5)
where Jion is the current through the membrane. χ represents the cell membrane area-to-volume ratio. The sign of the ionic current is positive when the current leaves the intracellular space and goes in the extracellular space (Mena and Bea, 2019).
The charge inside the cell membrane relies on the difference of membrane potential, or transmembrane potential V= Vi – Ve and the capacitance of the membrane:
V={q\over χC_m}(6)
where Cm is the capacitance of the membrane and q= (qi-qe)/2 (Mena and Bea, 2019).
Using the previous equations, we can obtain equations for the bidomain model:
∇\sdot (D_i ∇V)+ ∇\sdot (D_i ∇V_e)= C_m {∂V\over ∂t}+J_ion(7)
which describes the transmembrane potential propagation, and:
∇\sdot (D_i ∇V)+ ∇\sdot ((D_i+D_e)∇V_e)= 0
(8)
which describes the conservation of total current where Di=Mi/χ and De=Me/χ (Mena and Bea, 2019).
Monodomain Model
The bidomain model is said to be the most accurate numerical simulation for electrical impulses within the heart. It is oftentimes used to simulate action potentials and ECGs. The previous equations form a system of two parabolic reaction-diffusion equations (Bourgault and Pierre, 2010). They are usually coupled with a system of non-linear ordinary differential equations which describe ionic current through the cell membrane (Mena and Bea, 2019). The mathematical properties of this model are quite difficult to study (Bourgault and Pierre, 2010), which is why a simplification of the model was made.
The monodomain model approximates the bidomain model; however, it is much simpler. This simplification uses an anisotropic equation which incorporates a parabolic reaction-diffusion equation modeling the propagation of transmembrane potential as well as ordinary differential equations that illustrate a cellular ionic model (Mena and Bea, 2019). This model does not have a clear physiological foundation, but it remains commonly used in electro-cardiology, mainly because it is less computationally expensive than the bidomain model (Bourgault and Pierre, 2010). Sometimes the bidomain model can be decoupled, like how the membrane and calcium clocks can be decoupled too. We can explore the transmembrane potential with no regards to the extracellular potential thanks to the monodomain model. This model allows us to study the propagation and flow of action potentials in the heart (Mena and Bea, 2019).
Here is the parabolic equation describing reaction-diffusion:
∇\sdot (D∇V)=C_m {∂V\over ∂t}+I_{ion}(9)
Role of Fiber Orientation in Cardiac Electrical Propagation
Cardiac myocytes have a preferred orientation which we call ‘myocardial fiber-orientation'. This orientation is primordial to the fulfillment of electrical conduction in heart tissue (Gilbert et al., 2009). The helical orientation of fibers varies in a continuous manner inside myocardial walls located in the left and right ventricles. For example, the helicoidal fibers in the left ventricle play a part in the torsional motion of the heart and therefore improve the efficiency of pumping of the heart (Papadacci et al., 2017).
Myocardial fibers can rotate through 120 degrees from epicardium to endocardium. This rotatability allows myocardial tissue to acquire an anisotropic property which has a role in electrical spread dynamics and conduction (Gilbert et al., 2009). The configuration of cardiac myocytes is essential in the propagation of electric signals which excite sinoatrial node cells and trigger action potentials, contracting the heart (Bishop et al., 2009). In fact, electric signals in the heart spread in the direction of the fibers (Papadacci et al., 2017).

Conclusion
In this paper, we have examined the electrical components of the cardiac conducting system through a general and cellular point of view. We then moved on to the ways we can quantify and analyze the electric signals. This can be done with technology such as the electrocardiogram.
The difference between ECGs of reptiles and mammals is reviewed and the shorter duration of PR and QRS in mammalian and birds' ECGs could be explained by the factors such as temperature, the presence of conducting system and tissue architecture of the heart.
Afterwards, we analyzed possible disruptions to the cardiac conduction system such as heart blocks and ectopic foci.
The electrical properties of the heart, also known as cardiac electrophysiology, were studied using animal models and computational simulations such as the bidomain and monodomain. They have several advantages that typical measurements do not provide and help further our understanding of bioelectric signals (i.e., action potentials) in cardiac tissue. Furthermore, fiber orientation is essential to the conduction of electric signals within cardiac tissue.
The understanding of the heart's electrical circuitry has led to many discoveries and innovations that allow us to understand why disruptions happen and how to potentially fix them.
Appendix
Desai, Rishi. “Electrical system of the heart.”, 6 October 2012, khanacademymedicine, YouTube, https://www.youtube.com/watch?v=7K2icszdxQc.
Desai, Rishi. “Action potentials in pacemaker cells.” 7 October 2012, khanacademymedicine, YouTube, https://www.youtube.com/watch?v=OQpFFiLdE0E.
Desai, Rishi. “Action potentials in cardiac myocytes.”, 8 October 2012, khanacademymedicine, YouTube, https://www.youtube.com/watch?v=rIVCuC-Etc0.
References
Betts, J. G., Young, K. A., Wise, J. A., Johnson, E., Poe, B., Kruse, D. H., . . . DeSaix, P. (2013). Cardiac Muscle and Electrical Activity. In Anatomy and Physiology. Retrieved from https://openstax.org/books/anatomy-and-physiology/pages/19-2-cardiac-muscle-and-electrical-activity
Bishop, M. J., Hales, P., Plank, G., Gavaghan, D. J., Scheider, J., & Grau, V. (2009, 2009). Comparison of Rule-Based and DTMRI-Derived Fibre Architecture in a Whole Rat Ventricular Computational Model.
Boukens, B. J. D., Kristensen, D. L., Filogonio, R., Carreira, L. B. T., Sartori, M. R., Abe, A. S., . . . Jensen, B. (2019). The electrocardiogram of vertebrates: Evolutionary changes from ectothermy to endothermy. Physics meets medicine – at the heart of active matter, 144, 16-29. doi:10.1016/j.pbiomolbio.2018.08.005
Bourgault, Y., & Pierre, C. (2010). Comparing the bidomain and monodomain models in electro-cardiology through convergence analysis.
Burkhard, S., Van Eif, V., Garric, L., Christoffels, V. M., & Bakkers, J. (2017). On the Evolution of the Cardiac Pacemaker. Journal of Cardiovascular Development and Disease, 4(2). doi:10.3390/jcdd4020004
Chapelle, D., Fernández, M. A., Gerbeau, J.-F., Moireau, P., Sainte-Marie, J., & Zemzemi, N. (2009, 2009). Numerical Simulation of the Electromechanical Activity of the Heart.
Chorro, F. J., Such-Belenguer, L., & López-Merino, V. (2009). [Animal models of cardiovascular disease]. Revista Española de Cardiología, 62(1), 69-84.
Ebrard, G., Fernández, M. A., Gerbeau, J.-F., Rossi, F., & Zemzemi, N. (2009, 2009). From Intracardiac Electrograms to Electrocardiograms: Models and Metamodels.
Gilbert, S. H., Bernus, O., Holden, A. V., & Benson, A. P. (2009, 2009). A Quantitative Comparison of the Myocardial Fibre Orientation in the Rabbit as Determined by Histology and by Diffusion Tensor-MRI.
Ibrahim, A. O., Adediji, A. I., & Olufemi, D. J. (2013). Dynamical modelling of cardiac electrical activity using bidomain approach: The effects of variation of ionic model parameters. Journal of Biomedical Science and Engineering, Vol.06No.06, 11. doi:10.4236/jbise.2013.66076
Ikonnivov, G., & Yelle, D. (n.d.). Physiology of Cardiac Conduction and Contractility. Retrieved from http://www.pathophys.org/physiology-of-cardiac-conduction-and-contractility/
Janks, D. L., & Roth, B. J. (2009). The Bidomain Theory of Pacing. In I. R. Efimov, M. W. Kroll, & P. J. Tchou (Eds.), Cardiac Bioelectric Therapy: Mechanisms and Practical Implications (pp. 63-83). Boston, MA: Springer US. doi: https://doi.org/10.1007/978-0-387-79403-7_4
Kaese, S., Frommeyer, G., Verheule, S., van Loon, G., Gehrmann, J., Breithardt, G., & Eckardt, L. (2013). The ECG in cardiovascular-relevant animal models of electrophysiology. Herzschrittmacherther Elektrophysiol, 24(2), 84-91. doi:10.1007/s00399-013-0260-z
Klabunde, R. E. (2016, 10 Mar 2016). Ectopic Foci. Retrieved from https://www.cvphysiology.com/Arrhythmias/A017
Laske, T. G., & Iaizzo, P. A. (2005). The Cardiac Conduction System. In P. A. Iaizzo (Ed.), Handbook of Cardiac Anatomy, Physiology, and Devices (pp. 123-136). Totowa, NJ: Humana Press. doi: https://doi.org/10.1007/978-1-59259-835-9_9
Mena, A., & Bea, J. A. (2019). Chapter 7 – Multiscale Numerical Simulation of Heart Electrophysiology. In M. H. Doweidar (Ed.), Advances in Biomechanics and Tissue Regeneration (pp. 115-138): Academic Press. Retrieved from https://www.sciencedirect.com/science/article/pii/B9780128163900000078
Papadacci, C., Finel, V., Provost, J., Villemain, O., Bruneval, P., Gennisson, J.-L., . . . Pernot, M. (2017). Imaging the dynamics of cardiac fiber orientation in vivo using 3D Ultrasound Backscatter Tensor Imaging. Scientific Reports, 7(1), 830. doi:10.1038/s41598-017-00946-7
Ramahi, A. A., & Ruff, R. L. (2014). Membrane Potential. In M. J. Aminoff & R. B. Daroff (Eds.), Encyclopedia of the Neurological Sciences (Second Edition) (pp. 1034-1035). Oxford: Academic Press. Retrieved from https://www.sciencedirect.com/science/article/pii/B9780123851574000622
Solc, D. (2007). The heart and heart conducting system in the kingdom of animals: A comparative approach to its evolution. Experimental and Clinical Cardiology, 12(3), 113-118. Retrieved from https://www.ncbi.nlm.nih.gov/pmc/articles/PMC2323757/
Yanowitz, F. G. (n.d.). 6. ECG Conduction Abnormalities. Retrieved from https://ecg.utah.edu/lesson/6