Regulation of the Gut and its Effect on Animal Behavior
Trevor Hum, Xavier Santerre, Kyle Vamvakas, Mathilde Wagner
Abstract
This paper explores how neurotransmitters, chemical signals, and the enteric nervous system regulate this impressive organ. It then follows with an extensive account of how the gut microbiome influences social groups, recognition cues, and mating preferences among animals. Finally, acting as complementary sections for “Stable Isotopes and Diet Analysis: Insight into Trophic Level, and Geographical Origin and Location” (Hum et al., 2020), the last section of the report includes mathematical modelling of stable isotope composition in animals.
The Nervous System and Chemical Signals
An animal's gastrointestinal system requires a high level of control and autonomy due to its many functions and inner workings. To regulate such an important complex organ, animals use not only a multitude of neurotransmitters and chemical signals, but more importantly, the enteric nervous system.
The Enteric Nervous System
The enteric nervous system (ENS) governs the gut and is by far the largest and most prominent part of the peripheral nervous system. Due to its impressive level of autonomy, the ENS is often called the “second brain”. In fact, it has been estimated to have just as many, if not more, neurons than the spinal cord (Sonnenburg and Sonnenburg, 2015). This, however, is not without reason; since the gut has an incredible number of responsibilities, such as motility, control of gastrointestinal fluid, gut environment, etc., animals require a tight regulation of these functions. To do so, the ENS manages a vast, complex circuitry of neurotransmitters and neurons that are in two-way communication with the central nervous system (CNS). This communication is mediated by the vagus nerve, a cranial nerve that possesses the ability of both sensory and motor functions. In particular, the vagus nerve is essential for providing and receiving information to and from the gut (Seladi-Shulman, 2018).
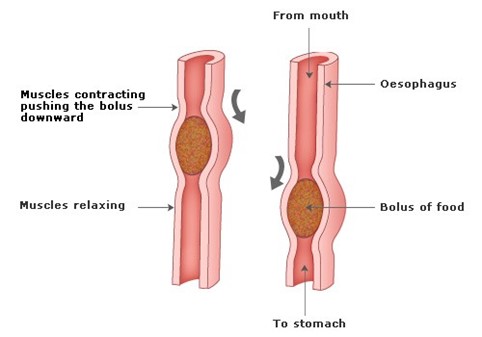
Once an animal has eaten, there must be some means for its body to autonomously propel its food along the gut. This is done through muscles along the gut that contract in various ways to achieve differing results such as movement of the food in long tracts, such as the esophagus and small intestine, mediated through waves of contraction, known as peristalsis, slow waves in the stomach to mix the chyme, and retropulsion when an animal vomits (Furness, 2007). The CNS, or more specifically the brainstem, oversees the mixing of the food in the stomach since it is the vagus nerve, connected to neurons within the ENS, that regulates those muscle contractions. On the other hand, the control of the intestine and the colon are maintained by reflex circuits, as well as various neurons that are all a part of the ENS (Furness, 2007).
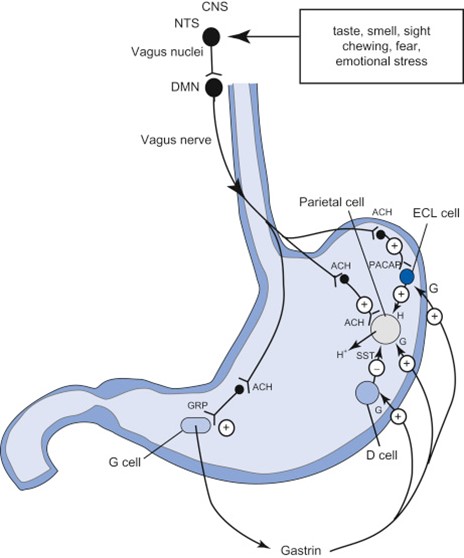
Another example of how the brain and the CNS communicate with the enteric nervous system is in the cephalic phase of digestion, which is entirely regulated by the vagus nerve. The digestion of food is a vital process in animals, and therefore, its efficiency must be optimized. However, if gastric juices are only secreted once stretch receptors in the stomach recognize the presence of food, there will be some wasted time in which the food is sitting in the stomach and not being broken down. Thus, animals have developed the cephalic phase to preemptively prepare for the arrival of food (Furness et al., 2014). This phase of digestion is triggered by visual or auditory stimuli, which get integrated in the CNS and conveyed to the ENS through the vagus nerve by the secretion of the neurotransmitters acetylcholine and gastrin. These will both activate the parietal cells of the stomach to secrete gastric juices and acid, as well as chief cells to secrete pepsinogen, an enzyme that will help digest proteins. In fact, it has been estimated that a fifth of the gastric secretions necessary for digesting a meal are secreted in the cephalic phase of digestion, before food even enters the stomach, and this is all due to the communication of information from the CNS to the ENS (Furness, 2007).
When an animal is in a relaxed state, it engages its parasympathetic nervous system, while in its “fight or flight” state, it engages the sympathetic nervous system. These are very important systems for animals and solves many problems for them depending on situations that they may find themselves in. For example, when an animal is being chased by a predator, it would want to dilate its bronchial tubules to get more oxygen and direct its blood flow in an optimal manner. It is important to note that while fleeing a predator, an animal's body would not be so interested in digesting its food but more focused on maximizing its capabilities to run away (Tracy, 2016). This implies that there must be some control mechanism that directs blood flow to the gut and, in fact, there is. Unfortunately, the ENS does not possess vasoconstrictor neurons, and thus, the CNS is fully in charge of switching between the two pathways through the usage of acetylcholine, nitrous oxide, which are vasodilators that are secreted in the parasympathetic pathway, and norepinephrine, a vasoconstrictor secreted in the sympathetic pathway, to control blood flow through capillary beds. However, the ENS does play a role in the parasympathetic nervous system by regulating the ion permeability of the intestine's mucosa to help maintain homeostatic electrolyte concentration in the body. This is done through the chemical signals known as vasoactive intestinal peptide (Salim, 2019).
Neurotransmitters
Neurotransmitters are chemical signals that are essential to the endocrine system of the body, which allows for organs in the body to communicate effectively. These messengers, or hormones, play a major role in how the ENS communicates within itself as well as with the CNS. Some of these have been mentioned above, such as acetylcholine, NO, and norepinephrine, but there are many more notable examples of such chemical messengers that are associated with the gut.
As previously mentioned, digestion of food is vital for an animal's survival. Thus, eating the right quantity of food is also essential. To solve this issue, animals use the hormones to regulate their appetite. Animals often rely on their body fat to retain energy, insulate their bodies and protect their internal organs. It is therefore important to maintain a healthy amount of body fat (Dutchen, 2010).
The first example of an appetite regulating hormone is leptin, secreted by said body fat, or adipose tissue. Leptin is a hunger suppressant. Thus, when an animal has too much adipose tissue, they will be less inclined to eat due to higher levels of leptin, but if an animal's body loses too much body fat, the leptin levels will decrease and the animal will wish to eat more. This is essential for the animal to find a balance in its body fat levels in the long term (Thomas, 2018). Similarly, in the small intestine, peptide YY is secreted after meals as an appetite suppressant, acting as a short-term appetite suppressant. On the other hand, in an experiment involving mice that were put on fasts, researchers noticed an increase in ghrelin, hunger stimulating hormone. Ghrelin is a long-term regulator of body mass and its secretion is stimulated by the vagus nerve, though the cells that produce the ghrelin, unlike leptin, are regulated by the ENS (Thomas, 2018). The food that animals eat must be broken down effectively in the stomach to be well digested in the small intestine. Thus, hormones such as histamine and acetylcholine, as well as gastrin, whose secretion is regulated by vagal stimulations, can activate parietal cells to secrete HCl-rich gastric acid (Prosapio et al., 2020), while serotonin, released from the CNS, will stimulate stomach contractions to mix up the food and acid into a chyme (McIntosh, 2018). However, the chyme might become too acidic and damage the lining of an animal's small intestine. To prevent this, the animals' pancreases react to a hormone known as secretin, releasing a bicarbonate-rich solution to buffer the chyme.
The Gut Microbiome: Signals of Communication and Recognition Between Individuals
Have you ever wondered why some individuals seem to be more attracted by one than another? Or how individuals communicate and recognize each other, or form groups? When we began our research of the gut and its influence on signaling and communication between individuals, we discovered how this exciting organ plays a role in nest mate recognition cues, or also in a kind of “friendship” preferences! As the gut microbiome and its effects on an individual is quite a new and hot topic, we still have a lot to learn and a lot more to investigate. Thus, the information collected thus far results from several diverse experiments and tests carried out, observing different populations of animals, using different samples, and varying several parameters. The data highlights how the gut microbiome — that is to say, the microbes present in the GIT — can influence and give signals suggesting mate choice, as well as kin recognition. For instance, the ‘holobiont', which is the term defining the interactions between hosts and their gut microbiota, has an important influence on animal's biology and more particularly on its social behavior, signaling mate choice (Pasquaretta et al., 2018). In fact, gut microbes can affect areas of the brain that control social interactions such as attraction, or areas that produce chemical signals, thus mediating communication.
To highlight and clarify the role of the gut microbiota in signalization, communication, and recognition between individuals, we will consider experiments done on two different populations: honeybees and drosophilae.
Experiments Led on Different Populations
Honeybees' Communication
To study the gut microbiota and its influence on animals' communication and recognition, simple model systems can help bring a better understanding of what is going on in more complex communities, such as in mammalian gut microbiomes. Thus, a possible approach would be to look at an animal which has evolved to harbor a native microbiota of low complexity. In fact, that is precisely the case of honeybees and, therefore, the reason why we run our tests on this population. Indeed, the honeybee gut microbiota is a ‘simple' community, as it is dominated only by seven to ten species (Kešnerová et al., 2017). Furthermore, the honeybee population represents an ideal system for our study of group membership because of its important social lifestyle.
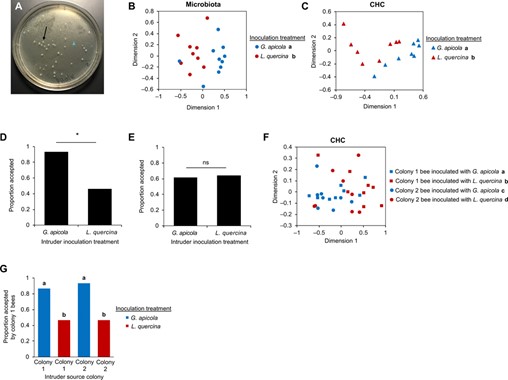
Recognizing cues for social group membership is a crucial ability for individuals, as it ensures the stability, strength and integrity of a social group. The gut microbiome “defines social group membership in honeybee colonies” (Vernier et al., 2020). The experiment carried out by Vernier et al. shows that nestmate recognition cues are defined by characteristics of the gut microbiome in honeybees. In this population, cuticular hydrocarbon profiles (CHC profiles) serve as pheromonal nestmate cues, while high intracolonic related members develop colony specific CHC profiles. Individuals' innate development of this colony specific CHC profile reveals that a non-genetic factor is at play. The data collected shows that it is a shared characteristic of the gut microbiome between honeybee colony members that defines nestmate recognition. Indeed, specific gut microbial communities in honeybees establish colony-specific recognition cues (Vernier et al., 2020).
It has been shown that variations in microbiomes result in variation in recognition cues. Thus, differences in the CHC profiles (serving as pheromonal nestmate recognition cues) from different honeybee colonies arise from “community-level variations in microbiota across colonies” (Vernier et al., 2020). To verify the hypothesis of the role of the gut microbiome, scientists manipulated the microbiome of sister bees by inoculating them with different gut bacteria. The influence of a nongenic factor, which is the gut microbiome composition, is illustrated below, confirming the hypothesis (Vernier et al., 2020).
Mating Preference of Drosophila Melanogaster
Another experiment was led on a different population: the drosophila. Data collected from various tests highlight the role of the gut microbiota in mating preference.
In the first experiment, flies were divided in two groups: one on standard cornmeal-molasses-yeast (CMY) and one transferred to a starch diet. Data from the experiment indicates that mating preference is correlated with selection favored novel adaptation to the environment (that is the different food sources). Thus, the emergence of diverse gut bacterial communities, associated with the two drosophila populations grown on different food sources, drives mating preference, which was, in the experiment of Sharon et al. (2010), the hypothesis tested. The variable parameter at play was difference of diet. The results reveal a significant positive sexual isolation index (SII): values greater than zero indicate positive assortative mating (Sharon et al., 2010).
SII={homogamic\space matings-heterogamic\space matings\over n(total\space matings)}(1)
SEM\space of\space SII=\sqrt{1-SII^2\over n}(2)
Four independent infection experiments — as well as a control experiment — were also led, showing further evidence confirming the hypothesis.
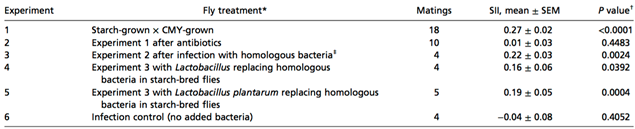
All the different experiments demonstrate that symbiotic bacteria were responsible for the homogamic preference (CMY*CMY and starch*starch), as the nest mates share similar gut microbes. Finally, the cuticular hydrocarbon (CH) composition of antibiotic treated and untreated CMY and starch flies was analyzed (Sharon et al., 2010).
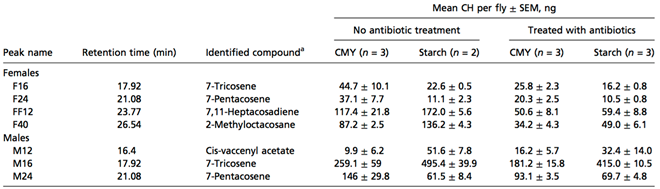
Thus, these data show evidence that the gut bacteria can affect the levels of fly sex pheromones.
Isotope Mathematical Mixing Models
As explained in the second installment, stable isotopes are used to determine the diet or the origin of a species. By looking at the composition of stable isotopes in tissues and bones, scientists can manage to retrace information that was lost in time or describe the daily diet of a mammal. To accomplish that, the use of mathematical mixing models is crucial.
Mathematical Mixing Models
Many different mathematical mixing models exist to track down information on a species. The different proportions of 𝛿13C and 𝛿15N stable isotopes in tissues can indicate the diet of the mammal. Therefore, it is possible to determine, by looking at old bones, when Greenland Vikings became sedentary (Arneborg et al., 1999), or the diet of extinct animals. Many different mixing models exist, but only the most popular ones will be considered in this section.
It is important to understand that the isotopic way of assuming the diet of a mammal reflects the assimilated diet and not the actual diet. The assimilated diet is the diet that is actually absorbed by the consumer. Many species ingest food they do not have the capacity to absorb, such as all non-ruminant omnivores who consume plants containing cellulose, as discussed in “Functions of the Gut Through the Perspective of Biological Mechanics” (Hum et al., 2020). It is also important to underline the possibility of seeing different 𝛿13C and 𝛿15N signatures throughout the same species, as the diet can be influenced by the temperature, the ecosystem and many other factors.
The first two mathematical mixing models are used to determine the ratio of stable isotope composition coming from the two main preys a predator feeds on (Phillips, 2012).
δ^{13} C_{mix}=f_1 δ^{13} C_1+f_2 δ^{13} C_2(3)
f_1+f_2=1
(4)
where,
𝛿13C is the composition of the carbon stable isotopes in the predator;
𝛿13C1 is the composition of the carbon stable isotopes in the tissue of the first prey;
𝛿13C2 is the composition of the carbon stable isotopes in the tissue of a second prey;
ƒ1 is the ratio of the first prey's 𝛿13C that is directly related to the predator's 𝛿13C;
ƒ2 is the ratio of the second prey's 𝛿13C that is directly related to the consumer's 𝛿13C.
The three 𝛿13C signatures can be determined with biological analysis. Therefore, there are 2 unknowns (ƒ1 and ƒ2) and 2 equations, allowing us to solve the system of equations with a simple substitution (Phillips, 2012). It is important to add a discrimination-diet tissue correction of 0.5 for the 𝛿13C signature to be more accurate. Thus, the formula becomes (Phillips, 2012):
δ^{13} C_{mix}=f_1 (δ^{13} C_1+0.5)‰+f_2 (δ^{13} C_2+0.5)‰(5)
Taking the bison as an example: in an experiment, scientists analyzed the muscular tissues of a bison to find that it had a 𝛿13C of – 21 ‰. Bison mainly consume C3 grasses (𝛿13C of -25.5 ‰) and C4 grasses (𝛿13C of -15.5 ‰).
-21 ‰= f_1 (-25.5+0.5)‰+f_2 (-15.5+0.5)‰
(6)
Then, using Eq. 4 and Eq. 5 to rewrite Eq. 6 in terms of f2, it becomes possible to find the percentage of C3 and C4 grasses consumed by the animal (Phillips, 2012).
-21 ‰=(1-f_2)(-25.5+0.5)‰+f_2 (-15.5+0.5)‰
(7)
f_1=0.6\space and\space f_2=0.4
(8)
Hence, we can conclude the diet of a bison consists of C3 grasses at 60 % and C4 grasses at 40 % (Phillips, 2012). It is possible to graphically represent the diet of the bison (Fig. 5).
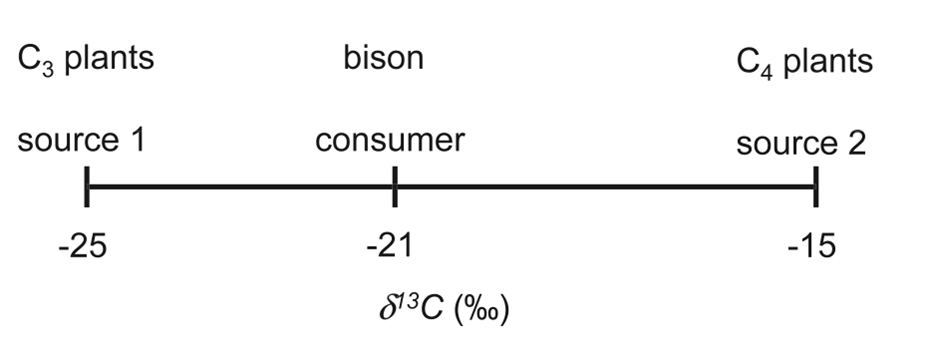
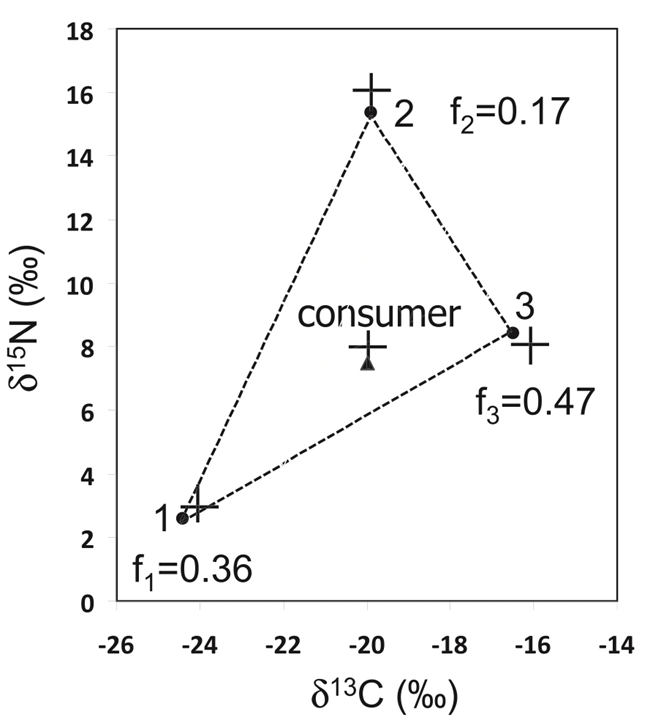
The predator's 𝛿13C should always be between the two preys' 𝛿13C. By considering Fig. 5, it is possible to observe that the diet of the bison consists of C3 plants more than it does of C4 plants. This understanding comes from the fact that – 21 is closer to – 25 than it is to – 15. If, by drawing the graph, the predators' 𝛿13C is not in between the two prey's 𝛿13C, it can be concluded that its diet is composed of more than two prey. We must then proceed to different calculations since there are now 3 unknowns. To do so, we must add an equation that represents the composition of the stable isotope of the nitrogen in the consumer's tissues (Phillips, 2012).
δ^{13} C_mix=f_1 δ^{13} C_1+f_2 δ^{13} C_2+f_3 δ^{13} C_3(9)
δ^{13} N_{mix}=f_1 δ^{13} N_1+f_2 δ^{13} N_2+f_3 δ^{13} N_3(10)
f_1+f_2+f_3=1
(11)
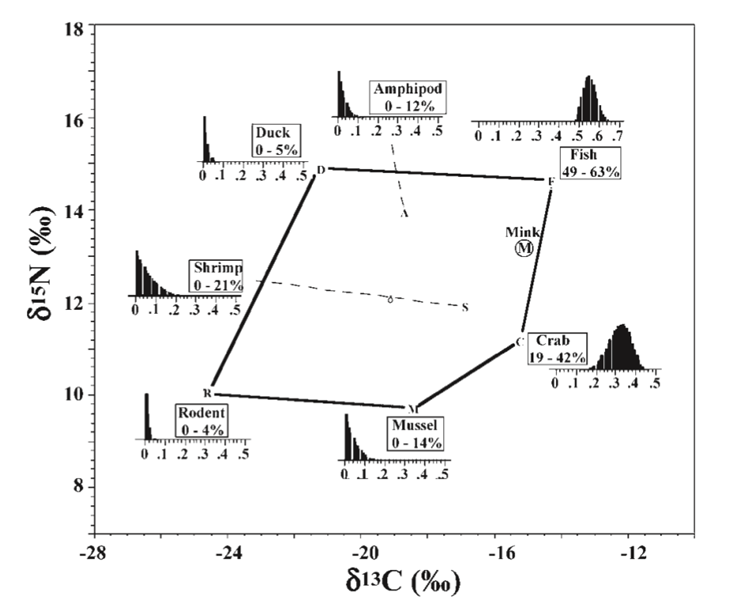
There are now 3 unknowns and 3 equations. The system of equations can be solved by substitution. It is again important to confirm that the 𝛿13C and 𝛿15N of the predator is between the 𝛿13C and 𝛿15N of the two prey, by plotting the diagram shown in Fig. 6 (Phillips, 2012).
Complex System of Equations
Using the mathematical mixing model described above, it is possible to find the percentage of n+1 prey if we have the stable isotope composition of n atoms. However, diets are usually more complicated and diverse than the examples seen above, making the system of equation too complex to be solved. For example, the coastal mink (Neovison vison) in southeastern Alaska has seven different prey, making it impossible to solve the system of equations (Phillips, 2012). However, Phillips and Gregg (2003) created a software called IsoSource, which is capable to approximate the percentage of each prey consumed (Phillips and Gregg, 2003 as cited in Phillips, 2012). To do so, the software creates all the possible combinations of the percentage of each prey so that with a difference of approximately one percent in between each combination. For example, the software would consider the possibility where ƒ1 = 1%, ƒ2 = 2%, ƒ3 = 23%, ƒ4 = 50%, ƒ5 = 4%, ƒ6 = 12% and ƒ7 = 8 % and where, ƒ1 = 2%, ƒ2 = 2%, ƒ3 = 23%, ƒ4 = 50%, ƒ5 = 4%, ƒ6 = 12% and ƒ7 = 7 %, until it has all the different possibilities. Then, the predicted stable isotope compositions of the predator are inserted in the second equation, using all the possible values of ƒ. These equations are then compared with the observed consumer values to identify the plausibility of the equation. For example, if the δ13C mix is equal to – 20 ‰ and δ15N mix is equal 12 ‰, then:
f_1 δ^{13} C_1+f_2 δ^{13} C_2+f_3 δ^{13} C_3+f_4 δ^{13} C_4+f_5 δ^{13} C_5+f_6 δ^{13} C_6+f_7 δ^{13} C_7=-20\pm0.2‰(12)
and
f_1 δ^{15} C_1+f_2 δ^{15} C_2+f_3 δ^{15} C_3+f_4 δ^{15} C_4+f_5 δ^{15} C_5+f_6 δ^{15} C_6+f_7 δ^{15} C_7=12\pm0.2‰(13)
Once the software has determined the plausible possibilities of the 7 ƒs, the minimum and maximum range of each specific dietary contribution is found, and a graph can be plotted (Phillips, 2012).
Conclusion
The gut is an essential organ to ensure the survival of any animal, possessing an array of elaborate operations that require tight regulation. To mediate this, the gut possesses an invaluable division of the peripheral nervous system, known as the enteric nervous system. It controls a large network of chemical messengers that are used to regulate the many functions associated to the gut, which communicate not only within the ENS but also, in large part, with the CNS.
Several tests and experiments run on different populations confirm that the gut microbiota plays a role in recognition between individuals. Indeed, it influences social group membership, recognition cues, and mating preference.
The gut is also responsible for the absorption of nutriments and thus, the absorption of stable isotope in the tissues of the body. Hence, it plays a decisive role in the discovery of information lost in time or the profound analysis of a species' diet. Stable isotope mathematical mixing models are the key intermediates allowing the link between the composition of a stable isotope in a tissue, and the meaning it has.
References
Arneborg, J., Heinemeier, J., Lynnerup, N., Nielsen, H. L., Rud, N., & Sveinbjörnsdóttir, Á. E. (1999). Change of Diet of the Greenland Vikings Determined from Stable Carbon Isotope Analysis and 14C Dating of Their Bones. Radiocarbon, 41(2), 157-168. doi:10.1017/S0033822200019512
Dutchen, S. (2010). What Do Fats Do in the Body? Retrieved from https://www.livescience.com/9109-fats-body.html
Feher, J. (2017). 8.2 – The Stomach. In J. Feher (Ed.), Quantitative Human Physiology (Second Edition) (pp. 785-795). Boston: Academic Press. Retrieved from https://www.sciencedirect.com/science/article/pii/B9780128008836000781
Furness, J. B. (2007). Enteric nervous system. Scholarpedia, 2, 4064. doi:10.4249/scholarpedia.4064
Furness, J. B., Callaghan, B. P., Rivera, L. R., & Cho, H. J. (2014). The enteric nervous system and gastrointestinal innervation: integrated local and central control. Adv Exp Med Biol, 817, 39-71. doi:10.1007/978-1-4939-0897-4_3
Hum, T., Santerre, X., Vamvakas, K., & Wagner, M. (2020). Stable Isotopes and Diet Analysis: Insight into Trophic Level, and Geographical Origin and Location. Bioengineering. McGill University. Montreal, Canada. https://bioengineering.hyperbook.mcgill.ca/stable-isotopes-and-diet-analysis-insight-into-trophic-level-and-geographical-origin-and-location/
Kešnerová, L., Mars, R. A. T., Ellegaard, K. M., Troilo, M., Sauer, U., & Engel, P. (2017). Disentangling metabolic functions of bacteria in the honey bee gut. PLoS Biology, 15(12), e2003467. doi:10.1371/journal.pbio.2003467
Kim, J. (2016). Irritable Bowel Syndrome, Gut Motility, and Probiotics. In. thryve.medium.com. Retrieved from https://thryve.medium.com/irritable-bowel-syndrome-gut-motility-and-probiotics-6ea8a1644c50
Krueger, H. W., & Sullivan, C. H. (1984). Models for Carbon Isotope Fractionation Between Diet and Bone. In Stable Isotopes in Nutrition (Vol. 258, pp. 205-220): American Chemical Society. doi: https://doi.org/10.1021/bk-1984-0258.ch014
McIntosh, J. (2020). What is serotonin, and what does it do? Retrieved from https://www.medicalnewstoday.com/articles/232248#takeaway
Pasquaretta, C., Gómez-Moracho, T., Heeb, P., & Lihoreau, M. (2018). Exploring Interactions between the Gut Microbiota and Social Behavior through Nutrition. Genes (Basel), 9(11). doi:10.3390/genes9110534
Phillips, D. L. (2012). Converting isotope values to diet composition: the use of mixing models. Journal of Mammalogy, 93(2), 342-352. doi:10.1644/11-MAMM-S-158.1
Prosapio, J. G., Sankar, P., & Jialal, I. (2021). Physiology, Gastrin. In StatPearls. Treasure Island (FL): StatPearls Publishing
Salim, R. (2019). An Introduction To The Sympathetic and Parasympathetic Nervous System. Retrieved from https://imotions.com/blog/nervous-system/
Seladi-Shulman, J. (2018). Vagus Nerve Overview. In. healthline.com. Retrieved from https://www.healthline.com/human-body-maps/vagus-nerve
Sharon, G., Segal, D., Ringo, J. M., Hefetz, A., Zilber-Rosenberg, I., & Rosenberg, E. (2010). Commensal bacteria play a role in mating preference of Drosophila melanogaster. Proceedings of the National Academy of Sciences, 107(46), 20051-20056. Retrieved from https://www.pnas.org/content/pnas/107/46/20051.full.pdf
Sonnenburg, J., & Sonnenburg, E. (2015). Gut Feelings–the “Second Brain” in Our Gastrointestinal Systems [Excerpt]. Retrieved from https://www.scientificamerican.com/article/gut-feelings-the-second-brain-in-our-gastrointestinal-systems-excerpt/
Thomas, L. (2018). Ghrelin and Leptin. Retrieved from https://www.news-medical.net/health/Ghrelin-and-Leptin.aspx
Tracy, B. L. (2016). Experiment: Activate Your Sympathetic Nervous System. In. backyardbrains.com. Retrieved from https://backyardbrains.com/experiments/Sympathetic_Nervous_System
Vernier, C. L., Chin, I. M., Adu-Oppong, B., Krupp, J. J., Levine, J., Dantas, G., & Ben-Shahar, Y. (2020). The gut microbiome defines social group membership in honey bee colonies. Science Advances, 6(42), eabd3431. Retrieved from https://advances.sciencemag.org/content/advances/6/42/eabd3431.full.pdf