Reaction Diffusion Patterns in Jaws of the Animal Kingdom
Michelle Levy, Riwa Itani, Joseph Marsilio, Irene Simier Requejo
Abstract
The endless number of patterns in nature is fascinating; they vary from spots on tigers, to lines on wood, to even teeth patterns in alligators. A mystery lies beneath all of this variety: how do these complex patterns arise and form such differing patterns? The origin of these patterns in biological systems can be explained mathematically with the morphogenesis theory laid out by Alan Turing, also called the “reaction-diffusion theory”. This theory can be applied to numerous biological systems, including the spatial patterning of teeth primordia in the alligator jaw. Reaction-diffusion theory explains how controlling the concentration of the morphogens in the alligator jaw allows for a dentition pattern to form. The same theory can also be applied to the palatal rugae formation, where several proteins ultimately dictate the final pattern. Denticles in sharks' skin also follow this theory. These denticles present on sharks gave rise to the outside-in theory, which hypothesizes that shark teeth in the jaw come from skin denticles. Through reaction-diffusion, shark-skin denticles are patterned in two rows on the dorsal surface of the shark. These animals end up with various phenotypes due to differing chemical compositions resulting in different competency wave speeds and diffusion patterns. This can be explained through Alan Turing's model, which emphasizes how impressive patterns can emerge in biology.
Introduction
In mathematical biology, a reaction diffusion theory has been developed in order to explain the emergence of different patterns in animals. In 1952, Alan Turing explained the “variety of puzzles” in biological development, later called “Turing patterns” (Turing, 1952). Turing suggested that chemical substances called morphogens react with one another to create patterns with different chemical compositions. This is known as the reaction-diffusion system or morphogenesis. Morphogens are signaling molecules that affect the cell directly, inducing a cellular response dependent on the morphogen's concentration; they etymologically mean “shape formers.” Members of the Hedgehog (Hh) family or TGFβ family are morphogens. They are not alone responsible for the cell fate, cell surface molecules also play a role in shaping the morphogen gradients. In the tissues where morphogens act, prepatterns and competencies play a role in determining the cell fate as well (Ball, 2021). This theory evolved later, it was established that the patterns were created as a result of two interacting ingredients, morphogens with specific characteristics. One is an “activator”, it activates itself and the inhibitor (autocatalytic) and introduces positive feedback. The other is an “inhibitor”: it inhibits the activator. The “inhibitor” has a faster diffusion rate and represses the autocatalysis of the activator. The activator creates local patches while the inhibitor prevents other patches from forming. Two known generic and regular types of patterns are spots and stripes (Fig. 1) (Ball, 2021). In biology, the Turing model is controversial because incomplete knowledge of the morphogens arises when comparing experiments and theory. This is true when considering the rate constants of the reactions, the mechanisms of intercellular coupling and the role of elasticity (Tompkins et al., 2014).
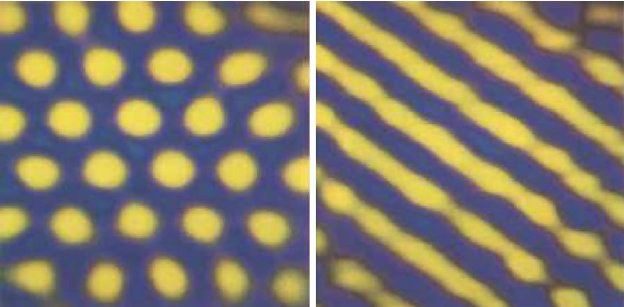
Fig. 1: Images of regular patterns such as spots and stripes (Ball, 2015).
Turing's theory
Turing's theory states that spatial pattern formation stems from reaction-diffusion systems. Beautiful patterns of animal coats can appear, and it is useful to understand these phenomena. For example, morphogenesis (how embryos develop their shapes in early stages) underlies similar processes. In some situations, chemicals react and diffuse in such a way that their steady state shows heterogeneous spatial patterns of concentration (Kuttler, 2011). In its simplest form, the reaction-diffusion equation is
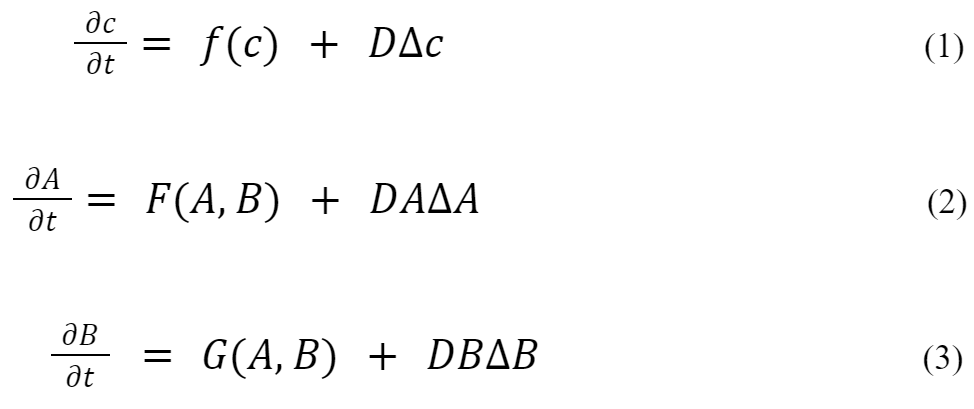
In (1), c denotes a vector of morphogen concentrations, f the reaction kinetics, and D the diffusion coefficients in the form of a diagonal matrix. To keep the equations as simple as possible, models for only two chemical species are represented, A and B, the kinetic terms. In (2) and (3), F and G are always nonlinear in this context. To understand Turing's idea, it is assumed that the system tends to a linearly stable state if no diffusion is present. Under certain conditions, a “diffusion-driven instability” may evolve, if DA is not equal to DB, i.e., spatially inhomogeneous patterns may show up. In order to form a pattern, one species should act as an inhibitor and the other one as an activator (Kuttler, 2011).
To have a better understanding of how diffusion patterns are generated, one can use a simple simulation of a reaction-diffusion model on a 2D grid (Sims, 2013). The system is approximated by using two numbers at each grid cell for the local concentrations of A and B. Both chemicals diffuse so that uneven concentrations spread out across the grid. In this model, A diffuses faster than B (Fig. 2)
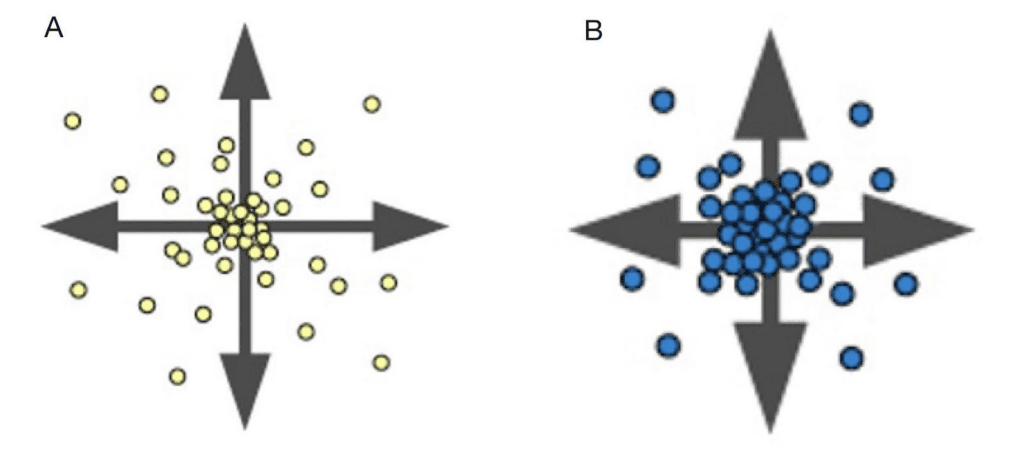
Fig. 2: Diffusion representation of each chemical in uneven concentrations (Sims, 2013).
The different diffusion rates will lead to different concentrations of these chemicals throughout the surface (Fig. 3A). In the model, when a grid of thousands of cells is simulated, we can see how these larger-scale patterns emerge. The grid is visualized by assigning each cell a color depending on the concentration of A and B. The more A, the more yellow the cell, while a higher concentration of B will make the cell more blue. The grid is repeatedly updated using the fraction diffusion equations to adjust the concentrations of A and B in each cell, and model the behaviors described above (Sims, 2013)
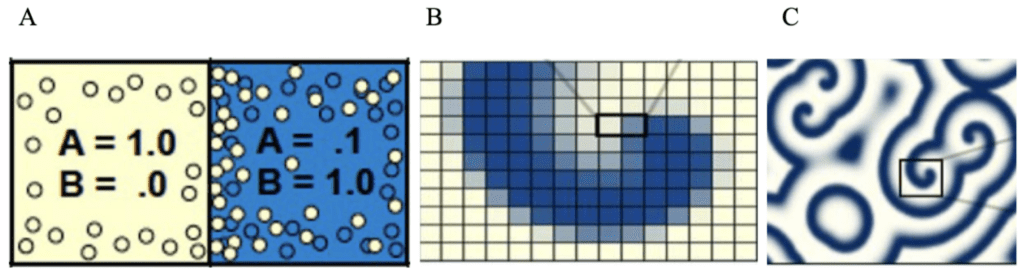
Fig. 3: Model representing how the distribution of concentration of the different chemicals led to pattern formation (Sims, 2013).
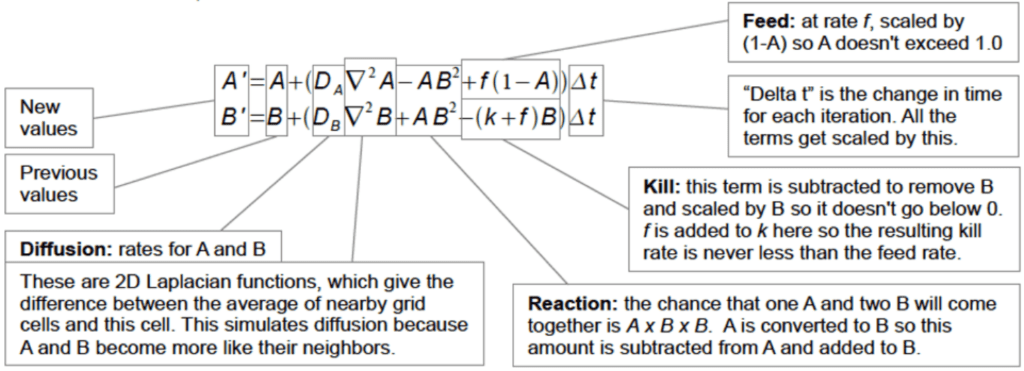
Fig. 4: Complex and dynamic behaviors of Reaction Diffusion (Sims, 2013).
To explain the above reaction-diffusion chemical reaction, we can look at the Gray-Scott system (Gray-Scott Model of a Reaction-Diffusion System Pattern Formation, n.d.). This system models the principle that there is a controlled amount of one substance being consumed (A) and another being produced (B). Take our previous example with the two chemicals, A (yellow) and B (blue), reacting and diffusing. When referring to Fig. 4, the variables A' and B' represent the concentrations of the two reacting substances, A and B. The left-hand side of the equation represents the time derivative of each of these concentrations, which describes the rate at which they change. The right-hand side of the equations both contain three separate terms. The first describes the diffusion of A and B, respectively. The second term describes the reaction between the two substances. In this example, B is produced at twice the rate at which A is consumed, resulting in the B value having a power of two. Since A is consumed in the reaction, the term has a negative sign in the first equation. In the second equation, it has a positive sign because B is produced. The last term of the first equation describes the rate at which A is externally replenished. This is necessary because otherwise A would be entirely used up. The feed rate is given by f and is multiplied by (1-A) to make sure A is only replenished at a rate that is coherent with its concentration, which should never exceed 1. In the second equation, the last parameter describes the removal of B in order to maintain the reaction, referred to as the “kill rate” expressed by the parameter k. So many different patterns can stem from changing the f and k parameters, which truly makes the reaction-diffusion theory fascinating (Gray-Scott Model of a Reaction-Diffusion System Pattern Formation, n.d.).
Spatial patterning of teeth primordia in the alligator jaw
In developmental biology, understanding how a homogeneous distribution of cells leads to organized structures is a central theme. However, the complex interactions of these mechanisms are not yet understood. In fact, very little is known about how embryonic cells organize themselves into very characteristic spatial patterns encountered in many body parts of living organisms. In this context, this paper will examine the formation of the vertebrate jaw and the development of dentition into an extremely organized structure. Since the study of mammalian dentition development is limited due to the inaccessibility of embryonic processes in utero, most of the studies on this topic have been carried out on crocodiles (Westergaard & Ferguson, 1990; Westergaard & Ferguson, 1986, 1987). These embryological studies have shown that jaw growth determines the developmental patterning of the tooth initiation process.
Tooth initiation process and jaw growth
The first indication of developing teeth primordia is the formation of localized condensation of epithelial cells causing thickenings of the oral epithelium called placodes. These placodes attract mesenchymal cells, which aggregate to form a localized condensation underneath the tooth site: the dental papillae. Early primordia degenerate into the mesenchyme and are resorbed or shed, while later primordia continue to develop and culminate in the formation of the mature shape and mineralized tissues of dentine, enamel, and cementum (Kulesa et al., 1996). This process is graphically explained in Figure 5. Although it illustrates the process of tooth formation in humans, the same sequence of early events is generally common amongst toothed animals. Subsequent primordia form in a similar manner, in a precise spatial and temporal sequence.
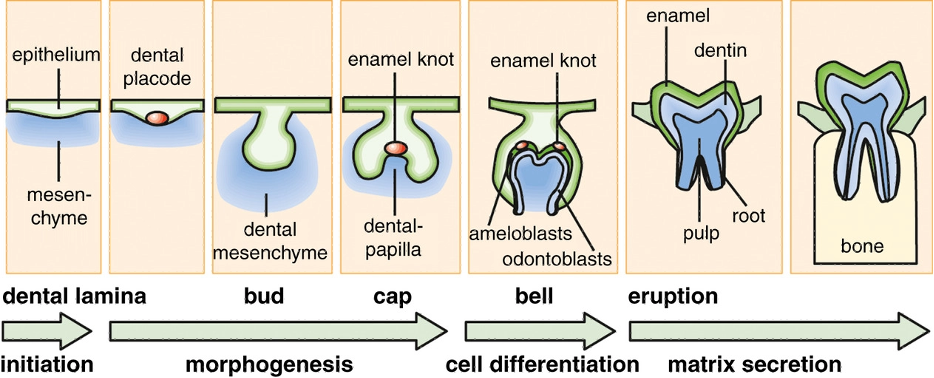
Fig. 5: Process of tooth formation (Thesleff, 2014).
Models for tooth formation
Early embryological investigations of dentition development in reptiles usually use either a prepattern formation model or a dynamic model to understand teeth patterns. Prepattern models are characterized by morphogens and rely on the concept of positional information (Wolpert, 1969). The diffusion of morphogens creates a gradient of concentration. During the tooth initiation process, primordium is formed depending on the response of cells to differences in morphogens concentration, which is the essence of positional information. Moreover, according to the dental arch theory, postulated by Edmund (1960), teeth positioning is determined by an initiation wave which proceeds from the midline of the jaw distally, and activates various pre-patterned tooth sites. On the other hand, dynamic models describe the development of patterns as self-generating, as a result of the growth of the system (Osborn, 1993). Finally, the clone model postulates that teeth initiate from clones of neural crest cells that form patterns due to the dynamic growth of the clones. The clones have edges, also called progress zones. Those expand in the anterior or posterior direction of the jaw. During the growth process, cell divisions may give rise to competent tissue for a new primordium to be initiated. Each new tooth is surrounded by an inhibition zone that prevents nearby tooth formation (Osborn, 1993). Following the same idea, as the clone expands, new teeth are initiated when sufficient space and tissue are available. Therefore, the smallest inhibitory zones and the largest growth of the clone will lead to a larger number of teeth.
Spatial patterning
The clone model was considered the most accurate at the time. However, recent work by Westergaard & Ferguson (Westergaard & Ferguson, 1990; Westergaard & Ferguson, 1986, 1987) demonstrated that the clone model is incorrect. In their work on alligator dentition, they observed distinct patterns of tooth initiation in Alligator mississippiensis: early primordia form wherever space is available. The first tooth primordium, or dental determinant, forms in the anterior part of the dental arch but is not the most anterior tooth to form. As we can see in Fig. 6, tooth initiation spreads from the dental determinant both forwards (medially, or towards the midline) and backwards (distally) in the jaw. As the jaw grows, interstitial primordia form in the growing spaces between two earlier primordia, closer to the more mature of the two. At the same time, new end primordia arise at the distal end of the dental arch at some distance from the former end primordia. Moreover, subsequent primordia can also form where an earlier primordium has been reabsorbed.
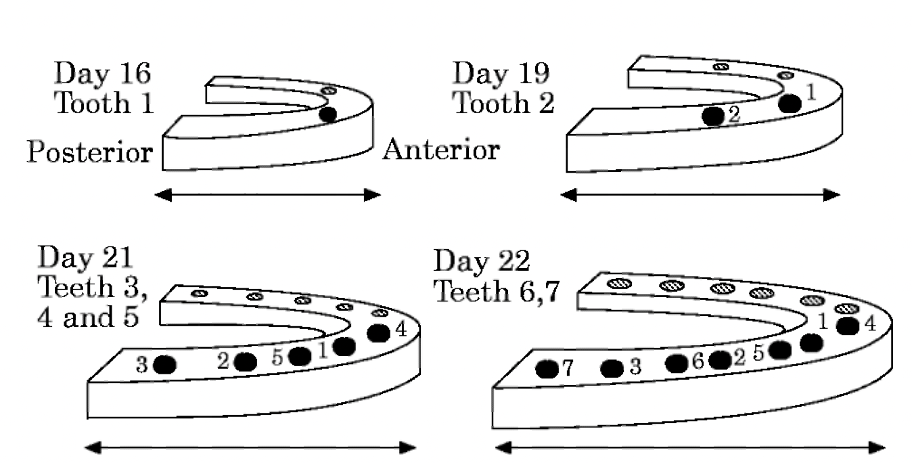
Fig. 6: Spatial pattern of the first seven teeth primordia in the lower half jaw of Alligator mississippiensis (Westergaard & Ferguson, 1986)
In this example, we consider only the first seven teeth as the formation of subsequent primordia is complicated by resorbing older teeth, cell differentiation, and differential jaw growth. Even if it is a simplified representation, two major conclusions can be drawn: the first is that tooth formation is directly related to the jaw growth, and the second is the existence of some inhibition zones around each developing tooth primordium, which diminishes with tooth maturity.
Tooth formation related to jaw growth
In the incubation period, the number of teeth formed increases exponentially over time (Fig. 7 A). However, if we look at the bigger picture, the entire course of development resembles more a Gompertz-like or sigmoid growth in the number of teeth primordia over the entire course of development (Fig.7B).

Fig. 7: Number of teeth N(t) vs. time t (days of incubation) for the first seven teeth primordia in the lower half jaw of Alligator mississippiensis (Kulesa et al., 1996).
These observations can be rationalized by thinking that in early development, jaw growth accelerates exponentially as cell division occurs. Thus, the number of initialized primordia will also grow at the same rate. This is true until a certain point at which the jaw growth decelerates and space starts to matter. At this point, the curve flattens until it reaches an asymptotic maximum at which there is no space for new teeth to grow.
Reaction-diffusion during jaw growth process
The identification of the involvement of epidermal growth factor, bone morphogenetic protein, and certain homeobox genes suggests that there is a chemical mechanism for the initiation of a primordium, in which certain substances react and diffuse forming gradients of concentration (Kulesa et al., 1996). These chemical gradients stimulate an area of the epithelium where the placode is formed. According to the reaction-diffusion theory proposed by Turing (1952), chemicals can react and diffuse to produce a homogeneous spatial pattern. In the case of alligator dentition, the dynamic reaction-diffusion mechanism is mediated by an inhibitor related to the concentration of epidermal growth factor (EGF). More specifically, the inhibitory substance concentration decreases as the concentration of EGF increases. Experimental evidence (Westergaard & Ferguson, 1986) suggests that the dental determinant as well as each subsequent tooth primordium becomes a source of inhibitor. Thus, as we can see in Fig. 8, when the concentration of substrate (u) grows above a certain threshold, there is a peak in the concentration of inhibitor (c). Mathematically, it means that each tooth gives rise to an internal boundary condition.
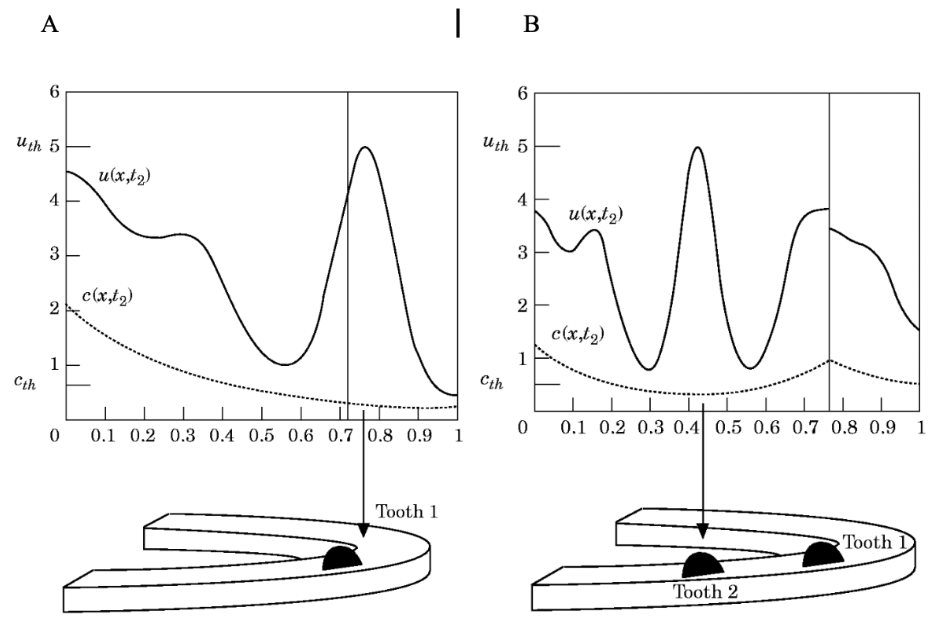
Fig. 8: The concentration profiles for the concentration of substrate (u) and inhibitor (c) for the formation of the first and second teeth (Kulesa et al., 1996).
As the jaw grows, the concentration of the inhibitor decreases. The first tooth primordium will form and create a new source of inhibitor. The jaw will continue to grow and the concentration of the inhibitor will fall again oncethere is enough space for the new primordium. The second tooth will then form, creating a peak in the concentration of substrate that will lead to a local increase in inhibitor concentration. The process will continue in a similar manner until the jaw stops growing. Then, the high concentration of the inhibitor will prevent the formation of new teeth since there will be no remaining space.
This mathematical analysis reflects that a reaction-diffusion system is capable of generating patterns by regulating the concentration of an inhibitor. A similar idea can be applied to the palatal rugae patterns discussed in the next section.
Palatal rugae patterns in mammals
The role of the palate is manifold: the separation of the nasal cavity from the oral cavity, the protection of the nasopharynx during swallowing, the transportation and sensing of food and more. Several homologies can be found in the palate across many species, one being the presence of rugae. Rugae are transverse ridges present on the hard palate, as can be seen in Fig. 9. They are found within all species of mammals (except whales) and are formed through diffusion patterns matching Alan Turing's model (Ankel-Simons, 2007).
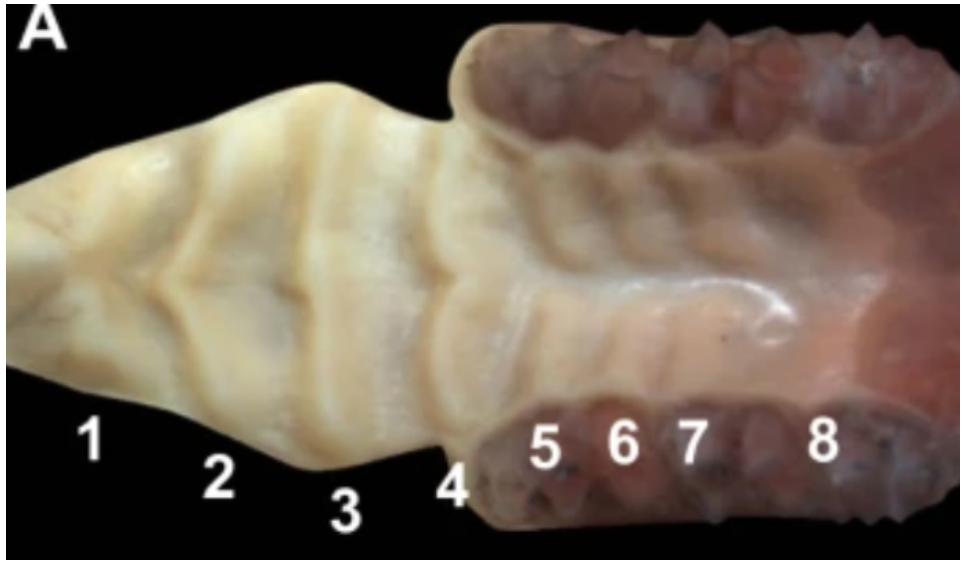
Fig. 9: Palatal rugae, ridges on the soft and hard palate, numbered from 1 to 8 in mice (Pantalacci et al., 2008).
All mammals have unique palatal rugae that allow for different functions, some to grab prey, others to ingest liquids. For example, dogs use their tongues to take in water and do so against gravity. Palatal rugae help by trapping water between the tongue and the palate (Regalado Ibarra & Legendre, 2019).
To analyze the formation of palatal rugae, Alan Turing's reaction-diffusion model can be applied. Sonic hedgehog (Shh) protein is a vital morphogen in the formation of symmetry in mammalian development. Shh is secreted in the neural tube during mammalian growth and diffuses cranially. Therefore, Shh ultimately determines dorsal/ventral symmetry in many areas of the mammalian body, specifically in the palate. Contrary to this, fibroblast growth factors (FGF) are released, and regulate Shh (Economou et al., 2012).
In Fig. 10, the rugae can be observed in the palate of mice. As the morphogen's diffusion governs the resulting phenotype, the concentration gradient plays a major role as well. This correlation between the rugae on the palate and the presence of Shh can be observed in Fig. 10 in B and C. These demonstrate the direct correlation between gene expression and resulting phenotypes.
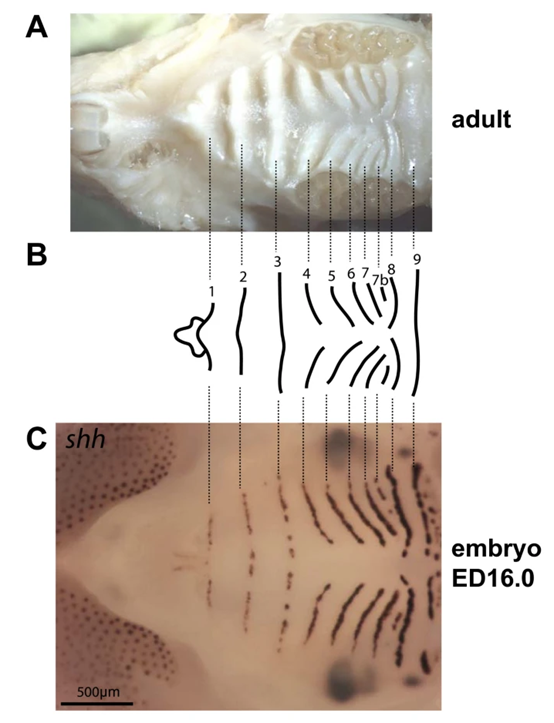
Fig. 10: (A) Demonstrating the rugae that form on the palate of mice. (B) Numbering the rugae and (C) demonstrating the correlation between the formation of the rugae and the Shh concentrations on the plate in the embryo.
In the formation of rugae on the palate, these can be observed with the morphogens Shh and FGFs. Using experiments altering the expression of Shh or FGFallowed researchers to observe their role in the formation of the rugae. As shown in Fig. 11B, the decrease of spry (a FGF inhibitor) led to an increased amount of FGF in circulation, resulting in more rugae. On the other hand, suppressing Shh resulted in abnormal, dense, rugae patterning. This suggested that FGF is the activator and Shh the inhibitor. In Fig. 11, the link between pattern formation and gene expression can be observed (Economou et al., 2012).
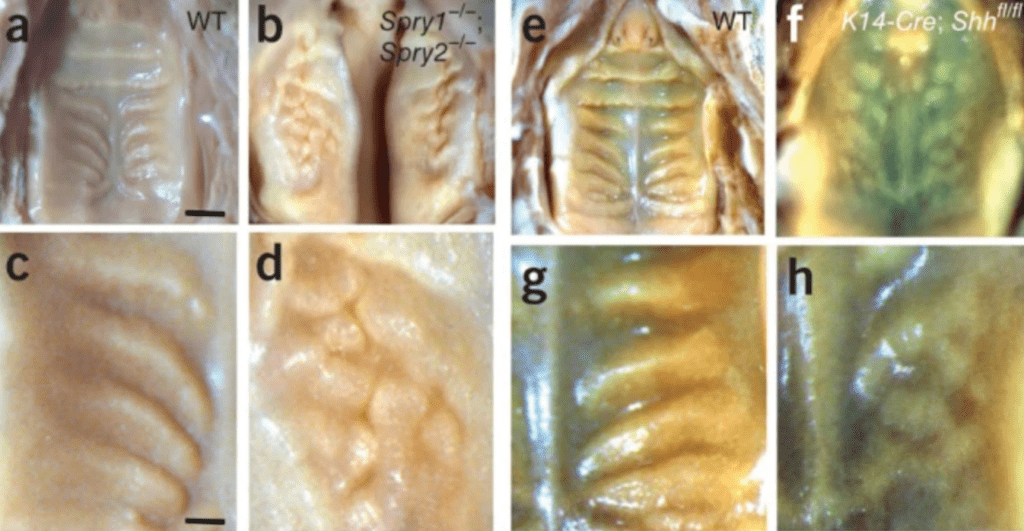
Fig. 11 (A, C, E, G): Wild type genes involved in the formation pattern of rugae in mammalian palate, specifically imaged in mice, demonstrating the normal patterning. (B,D): This is the result of increasing FGF by decreasing spry. (F,H): Demonstration of the downregulation of Shh (Economou et al., 2012).
Similar phenotypes were observed with the increase of FGF and the decrease of Shh, suggesting that they have common effects on the rugae. Therefore, based on these results, the conclusion could be drawn that more Shh results in less FGF, and a decrease in rugae formation (Economou et al., 2012). However, while one experiment may support one hypothesis and Alan Turing's models, another experiment can result in different conclusions.
In the experiment done by Economou (2012), Spry proteins are hypothesized to suppress FGF and were shown to have a similar mechanism as Shh. However, a different study showed inconsistent results when measuring levels of Spry. It was shown that with the overexpression of Spry, FGF was no longer inhibited, resulting in an abnormal and unpredictable phenotype – a lack of rugae (Goodnough et al., 2007). Therefore, it is difficult to draw definite conclusions from these experiments attempting to predict reaction-diffusion patterns as different conclusions are drawn for different concentrations of Spry. For example, Economou's study in which Shh is hypothesized to act similarly to Spry, is refuted by the experiment conducted by Goodnough.
Through Alan Turing's reaction-diffusion model, it can be exemplified how activator-inhibitor models create palatal rugae. Thismodel can also be applied to describe the formation of denticles in sharks.
Denticles in sharks
The “teeth skin” of sharks
Sharks not only have impressive teeth but also a unique tooth-like skin. These skin appendages or toothlike projections, known as denticles, serve both hydrodynamic and protective functions. Fig. 12 shows a magnified image of these denticles on various areas of the shark's body (Cooper et al., 2018).
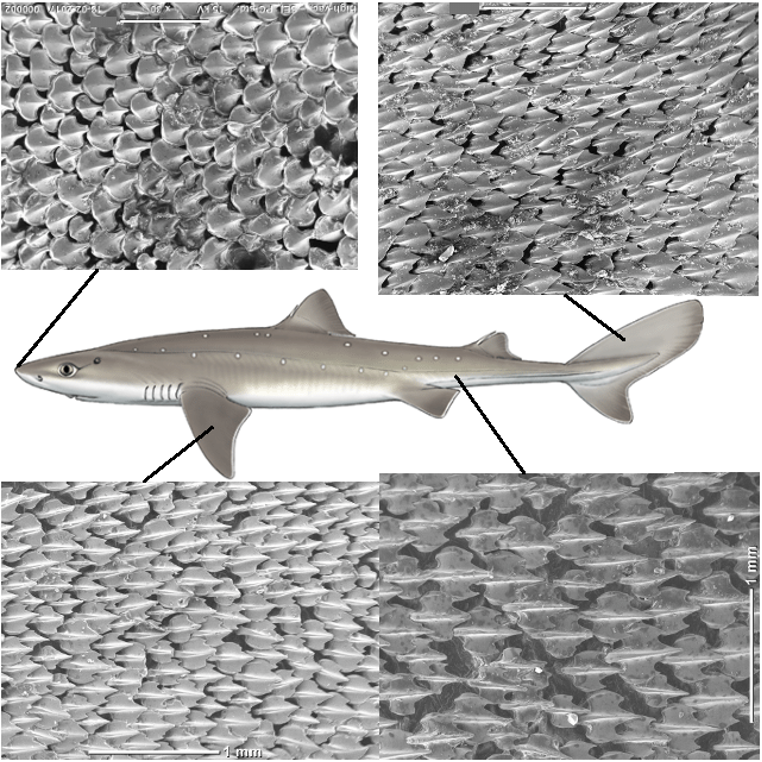
Fig. 12: Scanning Electron Microscopy (SEM) and magnification of shark denticles (Feld et al., 2019).
In the course of the research on denticles, some researchers (Cooper et al., 2018) follow the outside-in theory: the shark's skin teeth likely evolved before their oral teeth, and later the teeth's function changed from protection to food acquisition. Further down, we will see how other research contests the outside-in theory. However, an important finding is that denticle development is thought to follow Alan Turing's reaction-diffusion theory: equations that describe how molecular signals can interact to form complex patterns. In fact, this same system is also responsible for the patterning seen in a variety of epithelial appendages such as feathers and hair, with slight genetic modulation accounting for broad variations in patterning (Cooper et al., 2018). Through reaction-diffusion (RD) modeling, researchers found that two rows of denticles on the dorsal surface of the shark start the whole process, proving that shark-skin denticles are precisely patterned during development (Cooper et al., 2018), as can be seen in Fig. 13.
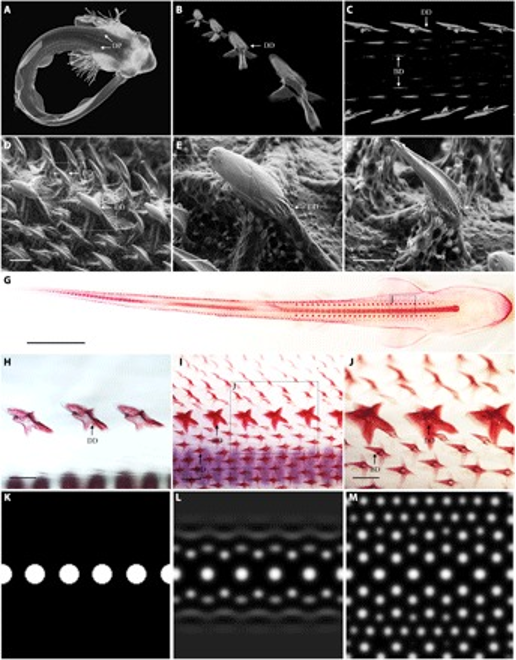
Fig. 13: RD modeling can explain catshark denticle patterning. Catsharks display two rows of dorsal denticle placodes (DP) at developmental stage 32 (~80 dpf). (B to E and C to J) These placodes undergo morphogenesis and mineralize to become dorsal denticles (DD). (C, D, F, and G to J) Their emergence precedes the subsequent eruption of parallel, adjacent rows of body denticles (BD). Dorsal denticles also begin to mineralize (H) before body denticle development (I). Dorsal denticles are longer and broader than body denticles (E, F, and J). RD modeling suggests that diffusion and interaction of an activator and inhibitor from an initiator row of dorsal denticles (K) can explain the patterning of surrounding body denticles (L and M) (Cooper et al., 2018).
In a study using RD simulation and gene expression, the results suggest that a Turing-like system underlies shark body denticle patterning (Cooper et al., 2018). The morphogenetic patterning of shark denticles was studied. Two rows of dorsal denticle placodes were visible at 80 days postfertilization, before observation of the development of body denticles. Compared to body denticles, dorsal denticles are larger and broader and do not have distinct ridges associated with hydrodynamic drag reduction. Simulation of a RD model was used to determine whether dorsal denticle rows can act as “initiator” rows, triggering the patterning of surrounding body denticles. Patterns were generated from a row of initiator spots representing dorsal denticles from which waves of activatory and inhibitory morphogens radiated according to predefined values. Spots formed in adjacent and parallel rows to the initiator row. Upon reaching a steady state, initiator spots remained larger than newly formed spots, reflecting squamation (i.e. scaling) of the shark skin. This study provides theoretical support for a Turing-like system controlling denticle patterning in sharks (Cooper et al., 2018).
Outside-in theory of shark teeth
There are two theories about how shark teeth originated: they either evolved from external denticles (the outside-in hypothesis) or from somewhere inside the mouth (the inside-out hypothesis).
Researchers studying a fossil from an extinct sawfish species that lived in North America about 100 million years ago, have found some evidence that supports the outside-in theory (Cook et al., 2022). This creature, known as the Ischyrhiza mira, had jagged spikes around its snout to guard itself against predators and also to hunt. They looked for similarities between these spikes, also called the rostral denticles, and the scales on the rest of their body. They found that the enameloid (enamel-like outer layer) of the rostral denticles resembled the enameloid of today's shark teeth. Like the tooth of a shark, the rostral denticle was made up of bundled packages of fluorapatite microcrystals, arranged in neat lines near the surface of the tooth and more randomly arranged lower down. In addition, these layers contain packed microcrystals positioned perpendicularly to the surface of the tooth. These different orientations give shark teeth their strength and stress resistance. For the Ischyrhiza mira, this construction enables them to withstand high impact and forces. This is evidence that the outer scales of a sea creature have the capacity to evolve into complex tooth-like structures outside of the mouth, thus supporting the outside-in theory for shark teeth evolution (Cook et al., 2022).
Also, to determine the degree of genetic similarity between teeth and denticles and search for markers uniquely associated with the successional regeneration of teeth, expressional patterns of several key regulators were investigated (Fig. 14). Overall, there is a conservation of gene expression patterns during the development of both teeth and denticles in the shark. These results suggest that a shared core odontogenic gene regulatory network (oGRN) is used to make odontodes in the oral or external modules of the exoskeleton, and that all odontodes share a deep molecular homology (Martin et al., 2016).
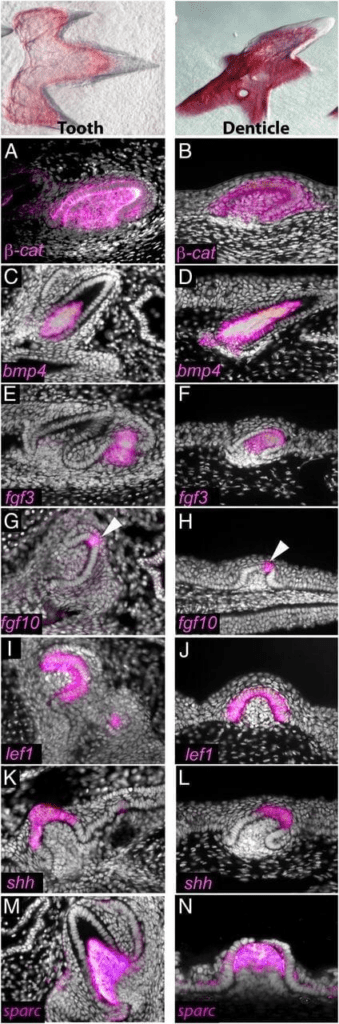
Fig. 14: Conserved gene expression profiles in shark teeth and skin denticles. Teeth (A, C, E, G, I, K, and M) and denticles (B, D, F, H, J, L, and N) exhibit similar expression patterns of many genes belonging to a core odontode gene network during representative stages of development (Martin et al., 2016).
New studies suggest that it was taste rather than touch that gave rise to the teeth. A research team from the University of Sheffield in the United Kingdom examined the stem cells of a shark embryo during its development and found that both teeth and taste buds develop from the same cells in the embryo's mouth. While some animals, including humans, have taste buds on their tongues, sharks have finger-like buds that line the mouth and pharynx and are concentrated mostly on the soft tissue just behind the teeth. By tracking the development of embryonic stem cells in the shark's mouth, the researchers established not only that these cells are the building blocks of both taste buds and teeth, but also that they hold the secret to a shark's ability to regenerate teeth – and taste buds – throughout their life (Martin et al., 2016).
Although it is true that shark teeth and dermal denticles (skin-teeth) are made of similar materials, denticles are unable to regenerate. At a genetic level, the makeup of denticles and tooth cells are almost identical, except that a gene known as sox2, which governs regeneration in many tissues of the body, is expressed in taste buds and teeth but not in dermal denticles (Martin et al., 2016).
In ancient fish,taste buds evolved before oral teeth, as evidenced by their presence in jawless fishes like lampreys (eel). So, although ‘skin teeth' (denticles) may look very similar to oral teeth, it is not surprising that a few pioneering taste-bud cells are the true originators of the modern shark tooth, giving sharks the ability to taste and tear their food simultaneously (Martin et al., 2016).
Overall, the study and findings suggest that evolutionarily conserved sox2+ ancestors have superficial taste-competent oral epithelium, which is the source of adult odontogenic stem cells responsible for the successional regeneration of teeth in the sharks. This sets teeth apart from all other odontode (teeth found on external surfaces or near mouth openings of animals) types and therefore serves as a reliable homology criterion for differentiating them from other odontodes. Although teeth and denticles are homologous as odontodes and share expression of most oGRN (original gene regulatory networks) components, shark teeth are more similar to taste buds in both their primary ontogenetic tissue and use of the sox2/β-catenin pathway during development and regeneration. These data, therefore, suggest that successionally regenerating teeth evolved as a result of a co-option of the gene regulatory network for odontodes (oGRN) into the oral cavity and its integration with the local sox2-modulated gene regulatory network for regenerating taste buds (tGRN) in early vertebrates (Martin et al., 2016).
How differences occur in geometric patterns with reaction-diffusion system
While alligator teeth, mammalian rugae and shark denticles rely on the same reaction-diffusion phenomenon to form, they result in different patterns, it raises the question of how this diversity occurs. This can be explained by different cell characteristics, diffusion patterns, anisotropy versus isotropy, cell density and the speed of competency waves.
In one study, competency waves were used to study the diffusion patterns of different morphogens and how they can alter the observed phenotypes (Liu et al., 2022). A competency wave is the wave of an imaginary barrier disabling the diffusion of the morphogen. This study allows for more insight into how the speed of the competency wave affects pattern formation. The following mathematical formula is used to determine the concentration of the morphogen (u) in the cell along with its concentration gradient (Du) (Liu et al., 2022).

Liu and co-authors used different speeds of propagation waves, denoted by alpha (α), to test their effects on the resulting pattern. They then held all other variables constant in order to allow for speed of competency waves to be the independent variable. They used different known models in order to provide a catalyst to the reactions (Schackenberg model and CDIMA model). The above formula was used to calculate the number of morphogens in circulation as well as to set the cellular environment to a constant density (Liu et al., 2022). The results of this experiment can be observed in Fig. 15 with the wave speed decreasing from left to right.
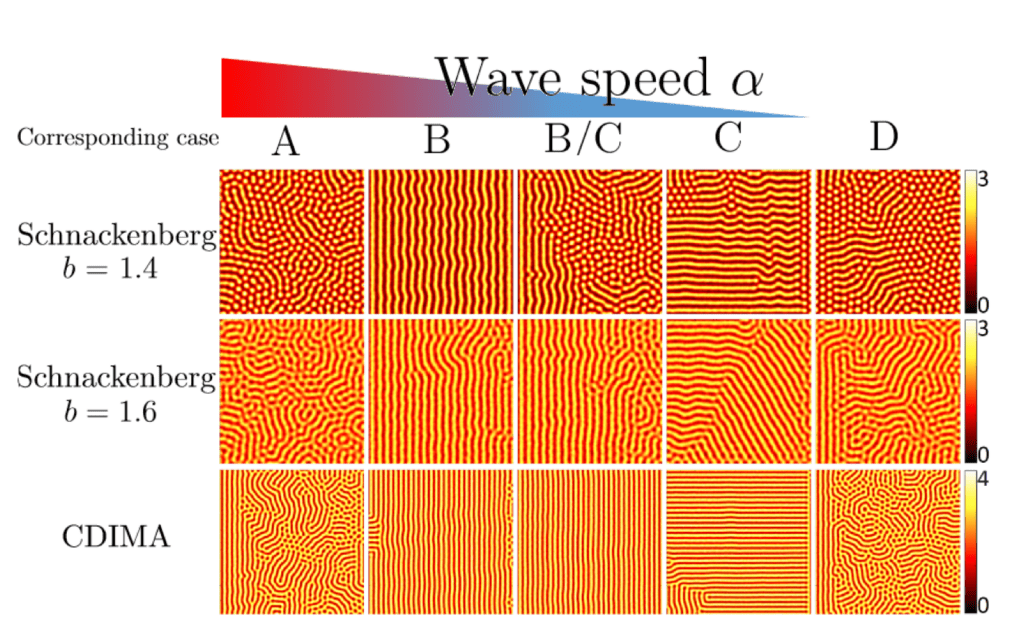
Fig. 15: Different models (Schnackenberg and CDIMA) demonstrating how differing competency wave speeds can affect the patterning of the biological system. In all the models, a high speed of propagation (A) results in a disordered labyrinth pattern. As the speed decreases slightly (B), the pattern becomes linear, suggesting that this is the only stable structure to be formed at this speed. As the speed further decreases, the pattern becomes increasingly different between each model, and the stable structure differs but remains mostly linear (Liu et al., 2022).
It can be observed that as the wave decreases in speed, the pattern alters, particularly by becoming more linear than spotty. This can be explained by the fact that as the morphogens are given more time to form into patterns, they can be disrupted by the noise in the system and become disordered. This is better shown in Fig. 16, using the Schnackenberg model, in which they set the propagation speed slower than before (Liu et al., 2022).
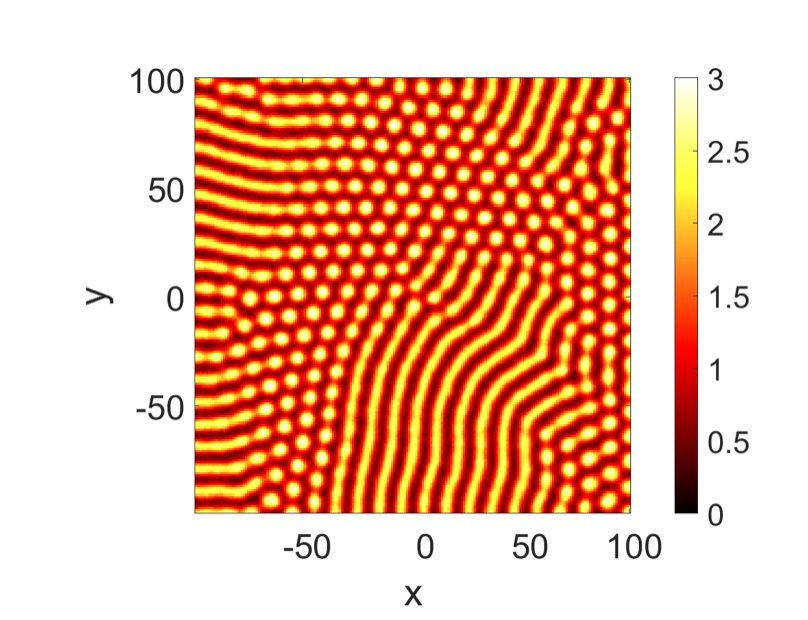
Fig. 16: Spotty pattern resulting from very slow propagation waves using the Schnackenberg model, displaying the effect of noise on the system (Liu et al., 2022).
The emergence of spotty patterns can be explained by the fact that with a slower propagation, the noise can destabilize the system and disorganize the morphogens, therefore creating spotty patterns. This type of propagation can also be applied to animals with spotty patterns, such as leopards, certain fish and also crocodile palates; and possibly explain the emergence of their amazing patterns, as can be seen in Fig. 17.

Fig. 17: Spotty pattern on crocodile palates (Yamazaki et al., 2013).
Another interesting phenomenon that could explain how amazing patterns are observed in nature is through the cellular environment. Often, the cell possesses either anisotropic or isotropic characteristics. Anisotropic refers to the ability for diffusion along different directions to have different values, as can be seen in Fig. 18. This can be compared to a wooden log. Wood is striped and therefore causes it to be much more rigid in one direction than the other. This is similar to cellular environments. With an anisotropic environment, it is easier for a morphogen to diffuse in one direction rather than the other, allowing for patterns to be formed. Opposite to this, cells can have isotropic environments in which the capability of diffusion for the morphogen is equal in each direction.
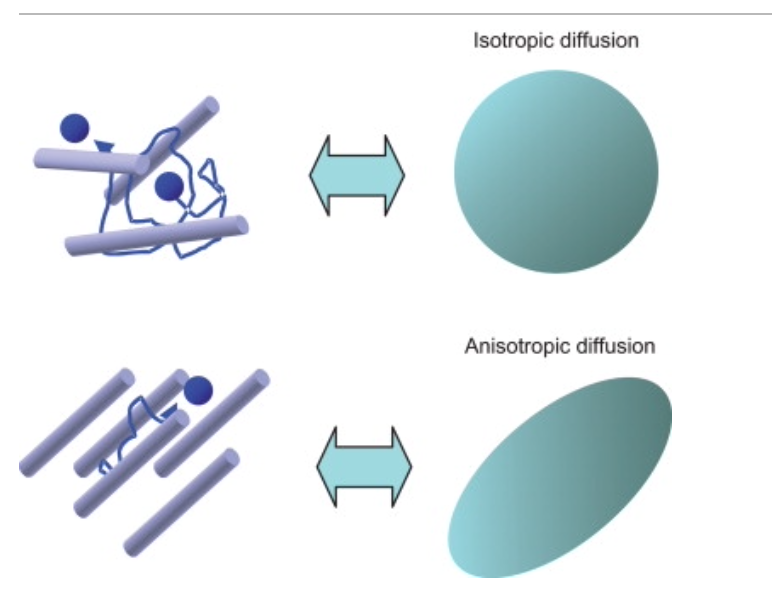
Fig. 18: Anisotropic and isotropic environments and how they can alter the diffusion of the particle to a specific direction (“Chapter 4 – Principle of Diffusion Tensor Imaging,” 2014).
This type of differing diffusion patterns (anisotropic and isotropic) may explain how mammalian palatal rugae end up in a linear structure and crocodile palate (Fig. 17) bears a spotty pattern. In addition to diffusion patterns, competency wave speeds and other factors aid in a deeper understanding of the variety of patterns that appear in biology.
Conclusion
The reaction-diffusion theory has revolutionized the mathematical biology world. This theory is applied to understand the spatial patterning of the teeth primordia in the alligator jaw. While the formation of the teeth can be explained through prepattern models characterized by morphogens, inhibition zones, sufficient space and tissues also play an important role in this process. The jaw growth can be described as a reaction-diffusion system. The concentration of the inhibitor decreases as new teeth form until the jaw stops growing, and the pattern is generated. The same theory is applicable to the formation of the palatal rugae patterns in mammals. They are formed by a protein (Shh) that determines the symmetry in the palate. Another morphogen (FGFs) regulates Shh, creating the diffusion patterns. Depending on the concentrations of proteins used, the results of reaction diffusion differ, which explains why they are very difficult to predict. Lastly, this theory also applies to the “teeth skin” of sharks. During development as well, the shark-skin denticles are patterned through molecular signal interactions. Alan Turing's reaction diffusion model is thus applicable to many patterning phenomena found in nature, including jaw formation. An infinite amount of patterns exist following two types of diffusion patterns, anisotropic and isotropic. Although the mystery behind the impressive variety in biological systems is gradually better understood, there is still very much to learn about the organization of cells along with the complex interactions and mechanisms that lead to these unique patterns.
References
Ball, P. (2021). Turing patterns. Chemistry World. Retrieved December 2, 2022, from https://www.chemistryworld.com/features/turing-patterns/4991.article
Ball, P. (2015). Forging patterns and making waves from biology to geology: A commentary on Turing (1952) ‘The chemical basis of morphogenesis'. Philosophical transactions of the Royal Society of London. Series B, Biological sciences, 370. https://doi.org/10.1098/rstb.2014.0218
Chapter 4 – Principle of Diffusion Tensor Imaging. (2014). In S. Mori & J. D. Tournier (Eds.), Introduction to Diffusion Tensor Imaging (Second Edition) (pp. 27-32). Academic Press. https://doi.org/https://doi.org/10.1016/B978-0-12-398398-5.00004-7
Cook, T. D., Prothero, J., Brudy, M., & Magraw, J. A. (2022). Complex enameloid microstructure of †Ischyrhiza mira rostral denticles. Journal of Anatomy, 241(3), 616-627. https://doi.org/https://doi.org/10.1111/joa.13676
Cooper, R. L., Thiery, A. P., Fletcher, A. G., Delbarre, D. J., Rasch, L. J., & Fraser, G. J. (2018). An ancient Turing-like patterning mechanism regulates skin denticle development in sharks. Sci Adv, 4(11), eaau5484. https://doi.org/10.1126/sciadv.aau5484
Economou, A. D., Ohazama, A., Porntaveetus, T., Sharpe, P. T., Kondo, S., Basson, M. A., Gritli-Linde, A., Cobourne, M. T., & Green, J. B. A. (2012). Periodic stripe formation by a Turing mechanism operating at growth zones in the mammalian palate. Nature Genetics, 44(3), 348-351. https://doi.org/10.1038/ng.1090
Edmund, G. (1960). 4. Evolution of Dental Patterns in the Lower Vertebrates. In W. M. C. Thomas (Ed.), Evolution (pp. 45-62). University of Toronto Press. https://doi.org/doi:10.3138/9781487571863-006
Feld, K., Kolborg, A., Nyborg, C., Salewski, M., Steffensen, J., & Berg-Sørensen, K. (2019). Dermal Denticles of Three Slowly Swimming Shark Species: Microscopy and Flow Visualization. Biomimetics, 4, 38. https://doi.org/10.3390/biomimetics4020038
Goodnough, L. H., Brugmann, S. A., Hu, D., & Helms, J. A. (2007). Stage-dependent craniofacial defects resulting from Sprouty2 overexpression. Dev Dyn, 236(7), 1918-1928. https://doi.org/10.1002/dvdy.21195
Käfer, K. Schulz, M. Gray-Scott Model of a Reaction-Diffusion System Pattern Formation.https://itp.uni-frankfurt.de/~gros/StudentProjects/Projects_2020/projekt_schulz_kaefer/#references
Kulesa, P. M., Cruywagen, G. C., Lubkin, S. R., Main, P. K., Sneyd, J., Ferguson, M. W. J., & Murray, J. D. (1996). On a Model Mechanism for the Spatial Patterning of Teeth Primordia in the Alligator. Journal of Theoretical Biology, 180(4), 287-296. https://doi.org/https://doi.org/10.1006/jtbi.1996.0103
Kutler, C. (2011). Reaction-Diffusion equations with applications. https://www-m6.ma.tum.de/~kuttler/script_reaktdiff.pdf
Liu, Y., Maini, P. K., & Baker, R. E. (2022). Control of diffusion-driven pattern formation behind a wave of competency. Physica D: Nonlinear Phenomena, 438, 133297. https://doi.org/https://doi.org/10.1016/j.physd.2022.133297
Martin, K. J., Rasch, L. J., Cooper, R. L., Metscher, B. D., Johanson, Z., & Fraser, G. J. (2016). Sox2+ progenitors in sharks link taste development with the evolution of regenerative teeth from denticles. Proceedings of the National Academy of Sciences, 113(51), 14769-14774. https://doi.org/doi:10.1073/pnas.1612354113
Osborn, J. W. (1993). A Model Simulating Tooth Morphogenesis without Morphogens. Journal of Theoretical Biology, 165(3), 429-445. https://doi.org/https://doi.org/10.1006/jtbi.1993.1199
Pantalacci, S., Prochazka, J., Martin, A., Rothova, M., Lambert, A., Bernard, L., Charles, C., Viriot, L., Peterkova, R., & Laudet, V. (2008). Patterning of palatal rugae through sequential addition reveals an anterior/posterior boundary in palatal development BMC Developmental Biology, 8(1), 116. https://doi.org/10.1186/1471-213X-8-116
Regalado Ibarra, A. M., & Legendre, L. (2019). Anatomy of the Brachycephalic Canine Hard Palate and Treatment of Acquired Palatitis Using CO(2) Laser. J Vet Dent, 36(3), 186-197. https://doi.org/10.1177/0898756419893127
Sims, K. (2013). Reaction-Diffusion Tutorial. https://www.karlsims.com/rd.html
Thesleff, I. (2014). Current understanding of the process of tooth formation: transfer from the laboratory to the clinic. Australian Dental Journal, 59(s1), 48-54. https://doi.org/https://doi.org/10.1111/adj.12102
Thomas (Ed.), Evolution (pp. 45-62). University of Toronto Press. https://doi.org/doi:10.3138/9781487571863-006
Tompkins, N., Li, N., Girabawe, C., Heymann, M., Ermentrout, G. B., Epstein, I. R., & Fraden, S. (2014). Testing Turing's theory of morphogenesis in chemical cells. Proceedings of the National Academy of Sciences, 111(12), 4397-4402. https://doi.org/doi:10.1073/pnas.1322005111
Turing, A. M. (1952). The Chemical Basis of Morphogenesis. Philosophical Transactions of the Royal Society of London. Series B, Biological Sciences, 237(641), 37-72. http://www.jstor.org/stable/92463
Westergaard, B., & Ferguson, M. W. (1990). Development of the dentition in Alligator mississippiensis: upper jaw dental and craniofacial development in embryos, hatchlings, and young juveniles, with a comparison to lower jaw development. Am J Anat, 187(4), 393-421. https://doi.org/10.1002/aja.1001870407
Westergaard, B., & Ferguson, M. W. J. (1986). Development of the dentition in Alligator mississippiensis. Early embryonic development in the lower jaw. Journal of Zoology, 210(4), 575-597. https://doi.org/https://doi.org/10.1111/j.1469-7998.1986.tb03657.x
Westergaard, B., & Ferguson, M. W. J. (1987). Development of the dentition in Alligator mississippiensis. Later development in the lower jaws of embryos, hatchlings and young juveniles. Journal of Zoology, 212(2), 191-222. https://doi.org/https://doi.org/10.1111/j.1469-7998.1987.tb05984.x
Wolpert, L. (1969). Positional information and the spatial pattern of cellular differentiation. Journal of Theoretical Biology, 25(1), 1-47. https://doi.org/https://doi.org/10.1016/S0022-5193(69)80016-0
Yamazaki, T., Yokoyama, M., Fujiseki, M., Moriguchi, M., Miake, Y., Sawada, T., Sohn, W.-J., Kim, J.-Y., & Yamamoto, H. (2013, November 5). Histological observation of the palate in alligator mississippiensis. Journal of Hard Tissue Biology. Retrieved December 2, 2022, from https://www.jstage.jst.go.jp/article/jhtb/22/4/22_455/_article