An Investigation into the Biophysical Relationship Between Predator-Prey Pairs
Andrew Xie, Dalya Messaoudi, Laurier Gauvin, Reefah Kabir
Abstract
Life, and therefore the very genes that determine its properties and expression, cannot stay stagnant as it is invariably fighting for shared territory, for shared resources, or alternatively, for the resources and nutrients that compose its very structure. Therefore, as there are near limitless ways to achieve a leg up on the competition, in the animal kingdom, we can observe countless instances of species evolved as a result of selective pressure, leaving scientists to discover the various subtle and not so subtle adaptations that a given group may have made to ensure the viability of its species. This article explored a wide variety of these adaptations, specifically as it related to biological physics, in order highlight the diversity of ways a species can evolve in the face of harsh predation or increasing difficulty thereof. We specifically started with examples from the realm of biomechanics, and then moved to morphological and behavioral adaptations that either come to increase or decrease predation.
Introduction
The most basic yet unavoidable instinct in most organisms is self-preservation. It requires every living organism to strive for their survival in their territory leading to distinct adaptations. In most cases, an adaptation in a lineage results in a counter-adaptation in the lineage associated predator or prey. This happens because the selection pressure is no longer the same and therefore results into an interspecies arms-race (Dawkins & Krebs, 1979).
It is possible to study these evolutive adjustments in a predator-prey pair and determine the factors which contributed to gaining an upper hand in a particular species. What follows is a portfolio of six pairs of species arms-races: lion-zebras, cheetah-impalas, dragonflies-fruit flies, bats-moths, honeybees-heavily armored hornets and finally electrical eels and fish. Throughout each of the following sections we analyze the physical aspects of adaptative behavior techniques and physiological advantages within each pair. We will discuss the biomechanics of the muscle fibers, interception and avoidance strategies, echolocation and calls detection, size and thermodynamics in a race and finally electrical discharges.
Lion-Zebras and Cheetah-Impalas – the Biomechanics of Pursuit
It is well established, both through mathematical models of locomotion and through experimental trials that for predator avoidance, speed and maneuverability are critical in the ability for prey to evade predation (Howland, 1974; Wilson et al., 2018). This is especially evident in the lion-zebra and cheetah-impala predator-prey relationships, where oftentimes a hunt means an all-out pursuit of one-another (Kruuk & Turner, 1967). This makes it imperative that the both the predators and prey in these relationships have the proper physical fitness to ensure the survival of their species; prey in pursuit scenarios need the mechanical capabilities to outmaneuver their attackers to survive, whereas the predators must possess the physical fitness to keep up to their prey to ensure the success of their hunts and their survival (Howland, 1974; Wilson et al., 2018). This makes the two pairs a prime case-study into the physical aspect of the predator-prey arms race.
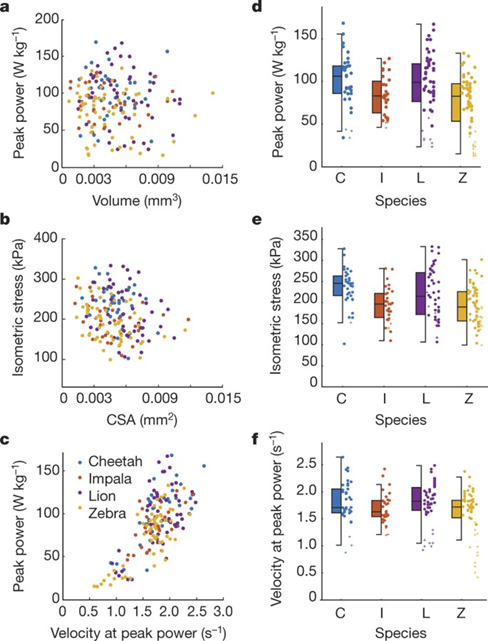
To understand this arms race, an investigation into the mechanics of the muscles fibers in each animal can be made. As shown in Figure 1, when mechanically testing single skinned muscle fibres from each species for their peak muscle power, their contraction velocity, and their maximum stress, high performance muscle fibers from the predator species show 20% greater maximum power compared to their respective prey species, although the difference was only statistically significant in the lion-zebra pair; whereas for contraction speed or maximum stress at peak power, there was no significant differences between predator-prey groups (though there is a nonsignificant trend in which both of these two values were higher for the predator species) (Wilson et al., 2018). What implications do these statistics in muscle fiber mechanics have? It shows that the physical properties of the muscle fibers between predator-prey pairs are similar to each other, revealing how close the arms races are on a muscular scale. However, the greater maximum power in predators theoretically represent better movement for them, as “maximum power output… is assumed to be critical for speed, acceleration, and turning performance” (Wilson et al., 2018).
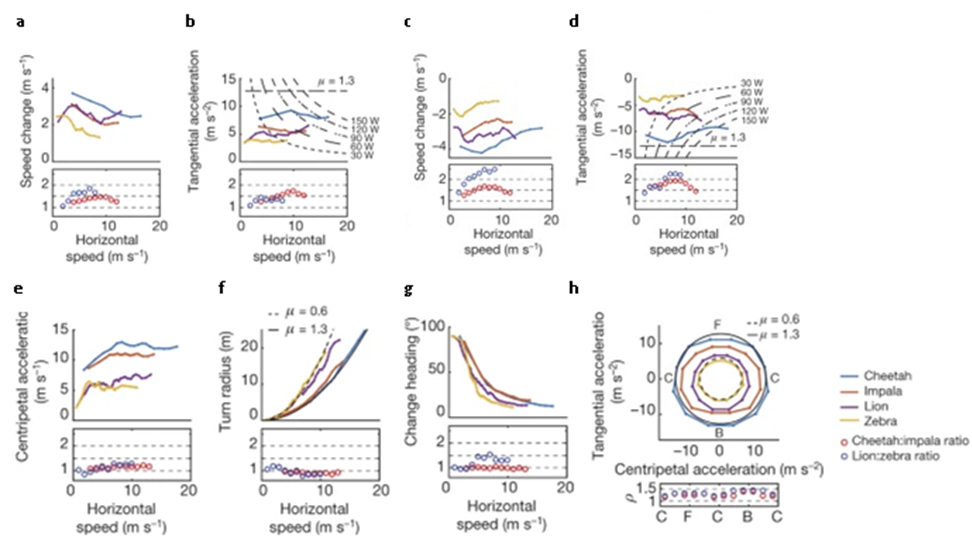
Another vector that may be used to understand this arms race is the species’ speeds, accelerations, and turning ability. Figure 2 reveals that the lions and cheetahs have decently better abilities in terms of linear movement in comparison to their respective prey (acceleration/deceleration, maximum speed), however predators are only slightly better when looking at rotational movement (centripetal acceleration) (Wilson et al., 2018). These statistics are consistent with the idea of predator fitness vs prey maneuvering, and it evidently shows the arms race between the predators and prey in each pair. In its simplest form, the arms race between the predator-prey pairs may be expressed in that the impala and zebras must keep evolving to have better turning abilities so that they may outmaneuver cheetahs and lions, respectively, who must keep evolving to be faster and more maneuverable to catch their prey, especially since the cheetah and lion are the ones who must react to the impala and zebra’s changes in movement (Howland, 1974; Wilson et al., 2018). Figure 2 also reveals just how particular the predator-prey relationship between the two pairs are; when comparing the ratios of the predator-prey’s physical abilities to each other, the numbers often hover between 1-2, with the ratio of speed between the predator-prey pairs being the only exception with a ratio of over 2 for the lion-zebra relationship (part c) (Wilson et al., 2018). These ratios show that if any species were to suddenly gain even a small boost in these physical values, the effect on the relationship would be significant. If a predator were to gain a boost in these values, the ratio would increase in a significant fashion with many values hovering around 2, meaning that prey would not have the physical capacity to outmanoeuver their predators as their predators are much more physically fit, whereas if a prey species were to gain a boost in these values, the ratio would tend towards 1 or become less than 1, meaning that their respective predators would express a great inability to capture them, as the prey would be able to simply outmanoeuver or run away from their predator.
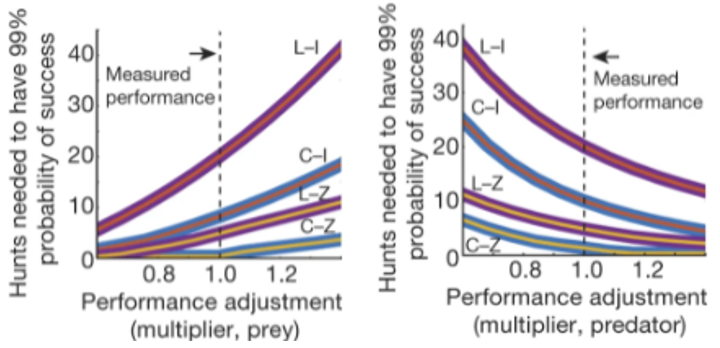
The idea that a small change in the values represented in Figure 2 would have a significant impact on the predator prey relation can be corroborated with mathematical models; as shown in Wilson et al.’s models (Figure 3), a small adjustment in performance multiplier (boost to kinematic values such as velocity or acceleration) can have steep repercussions in the probability of a successful hunt (Wilson et al., 2018). The implications in having such a significant difference in the number of hunts needed to have a 99% probability of success with even a low multiplier such as 1 +/- 0.2 in predator or prey performance is that one species would become significantly less successful; with less successful hunts for the cheetah or the lion, there would be less food, leading to their decline, whereas with more successful hunts, the zebra and impala populations decline. Wilson et al. (2018) put this quite well: “…overall, the athletic capabilities of the two pursuit predators closely match their respective common prey, leading to a sustainable success rate, survival of both and reflecting an evolutionary arms race. The predators have higher muscle power, are faster and have a greater capacity to accelerate and decelerate than their prey. The prey can match their predator’s locomotor capabilities most closely through turning maneuverability, affording them a critical escape space.”
Dragonflies and Fruit Flies – Interception and Unconscious Avoidance
In order to thoroughly investigate the arms race between the hunting dragonfly and the fruit fly, a proper understanding of their methods of hunting and evasion, respectively, must be made.
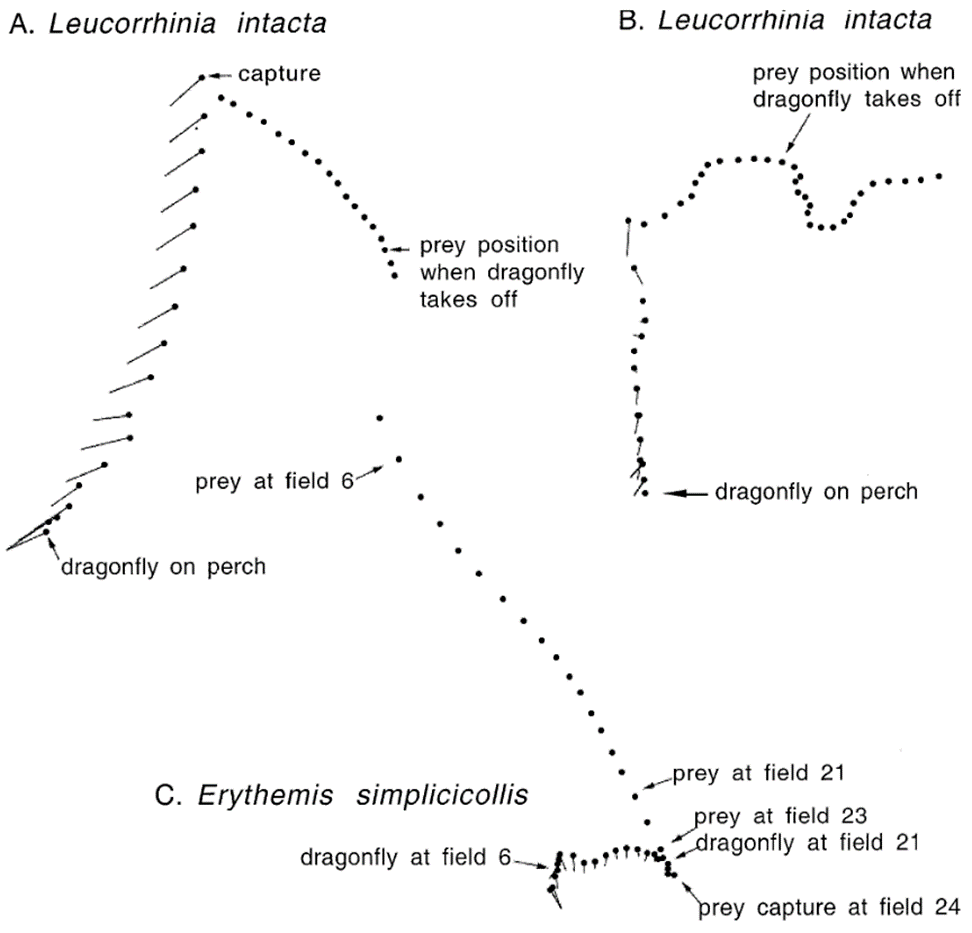
Dragonflies hunt their prey through “interception,” a method of predation where the predator captures its prey through predicting its flight path and flying directly towards a point in the predicted path to capture the prey (Fig. 4) (Olberg et al., 2000). They approach their prey from below, rotating their heads to fixate their view on their prey so that they are able to maintain a constant retinal position, so that it may accurately predict the flight path of its prey and make corrections if necessary (Olberg et al., 2007). Combes et al. (2012) investigation into the fruit fly’s reaction to attacks suggests that this method of attack also provides the dragonflies with an additional element of surprise; over 80% of the time the fruit flies failed to show any obvious evasive response to an impending dragonfly attack. They are extremely successful through their methodology, with experimental capture rates as high as 97% (Olberg et al., 2000).
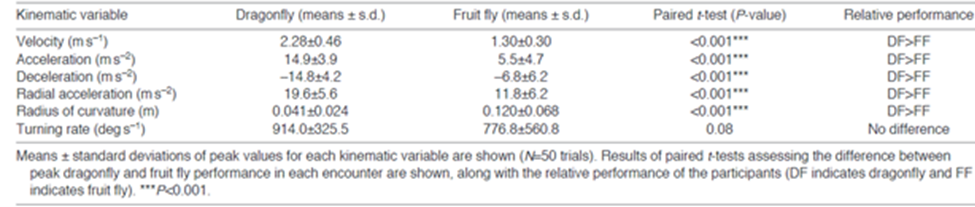
When an investigation is made into the flight performance of dragonflies and fruit flies, it is found that the dragonfly significantly outperforms the fruit fly in most flight performance tests other than turning rate, where dragonflies still show a nonsignificant advantage (Table 1) (Combes et al., 2012). However, if the dragonfly has such a significant advantage in locomotion, combined with the aforementioned element of surprise in their attacks, why are certain fruit flies still able to evade predation?
TABLE I. “Relative flight performance of dragonflies and their prey.” (Combes et al., 2012)
In regular flight, fruit flies fly in flight patterns characterized by periods of straight-line flight paths and 90° turns (Reynolds & Frye, 2007). Although this has been shown to be due to their strategy of searching for food or navigation around obstacles (Reynolds & Frye, 2007), it also serves a significant purpose in the fly’s ability to escape from predators. Because the dragonflies use the method of interception, by making an unpredictable last-second turn, the fruit fly disallows the dragonfly to change its own course in time, leading to an unsuccessful hunt. As Combes et al. (2012) put it: “The random turn performed during cruising flight not only allow flies to explore their environment thoroughly (locating mates or food sources and potentially detecting predators), but just by virtue of being erratic, this turning behavior may also allow flies to escape from approaching predators without even knowing it.”
This is not to say that the maneuverability of each member of the predator-prey species is not significant; in Combes’ experiment, there were only 8 instances where fruit flies did show attempts to evade predation from the approaching dragonfly, only half of these (4) were successful in avoiding predation, and another half (2) of these were succeeded by a subsequent reapproach and capture from the dragonfly (Combes et al., 2012).
The predator-prey arms race between dragonflies and fruit flies shows that although maneuverability of the two species may play a role in the predator-prey arms race, a more significant part in understanding the biomechanical arms race between the two may stem from understanding the behaviors of each organism not only during periods in which the one is pursuing or attacking the other, but also in their normal flight patterns and movement.
Bats versus Moths – Echolocation and Evasive Flight
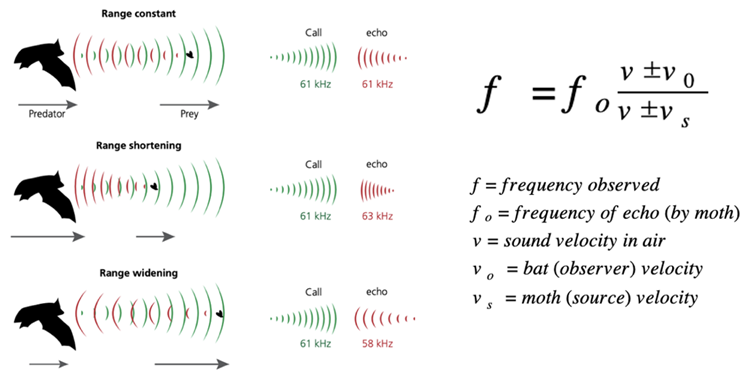
Another unique predator-prey pairing would be the bat and the moth. Bats, the only flying mammals, emit sound signals as a technique to catch their prey. These mammals generate sounds by vibrating their vocal cords with response to the flow of air in their larynx (Kobayasi et al., 2012; Sillar et al., 2016). These acoustic signals are emitted either through the nose or the mouth. These mechanical waves can have a fundamental frequency, usually of between 30 to 40 Hz, but they can also consist of harmonics (or multiples of the fundamental frequency) as high as 200 Hz (Kobayasi et al., 2012; Sillar et al., 2016). These sound waves can then hit a specific target to reflect the waves back to the emitter as echoes. The reflection of the sounds is what aids the bat in locating their prey. This method is called echolocation (Kobayasi et al., 2012; Sillar et al., 2016). One way of utilizing the echoes is to estimate the velocity of prey. According to the concept of the Doppler shift, when the bat emits a sound wave and the prey is moving at a constant speed, the frequency of the echo is identical to the emitted frequency (Fig. 5) (Sillar et al., 2016). As the prey approaches the predator, the echo frequency gets higher as well. The flying mammal can also guess the distance between them and the moth, since the distance is directly proportional to the time delay and the distance depends on the speed of sound in air (343 m/s) (Sillar et al., 2016).
When it comes to hunting their prey, bats first search for their potential meal by repeatedly emitting sound waves in their environment (Sillar et al., 2016). If they detect a potential target, they increase the frequency of their sound pulses to stay updated on the information of their potential prey and try to approach it (Sillar et al., 2016). When the bat is sufficiently close to the moth, with the help of sound pulses repeating at a rate as high as 200 Hz, they prepare for capture by embracing the victim with the membrane between their wing and their tail and bringing it closer to their mouth to consume it (Sillar et al., 2016).
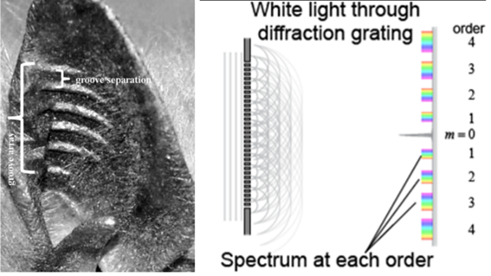
The external ear structure of the bats is also unique in its appearance and functionality. The auditory structures are curved, and they contain horizontal ridges (Fig. 6) (Keeley et al., 2018; Kuc, 2009). These ridges were previously thought to provide structural integrity to the ears. However, a few researchers suggest that the external structure is acting as a Fresnel lens (Keeley et al., 2018; Kuc, 2009). The lines act as a diffraction grating allowing waves of higher frequencies (above about 150 Hz), usually coming from preys, to enter the ear canal (Keeley et al., 2018).
Although echolocation seems to be an effective technique for bats to win their battle for food, moths also have effective strategies to deter their predator from catching them. In fact, 87% of moths that were captured by bats did not utilize escaping strategies (Waters, 2003). Indeed, moths with ears can have the ability to hear and detect the calls of their predator from a longer distance, especially if the bat calls’ frequencies are lower (Sillar et al., 2016; Waters, 2003). When they notice their presence from far, the moths flap their wings in an unpredictable manner to destabilize the echoes that are headed towards the bat (Sillar et al., 2016). Additionally, since they are also capable of knowing the direction where the bat is originating, moths commence their directional flight to distance themselves from the predator and the zone surrounding it (Goerlitz et al., 2020). However, it can be difficult for moths to notice the presence of their attacker from a long distance if their calls are of higher frequencies (Waters, 2003). Thus, if the bat seems to be too close (less than 5 m), the moth has to urgently dive or make spirals to lose their predator (Waters, 2003). Yet the bat has a tendency to initiate flying acrobatics such as back flips or dives to catch their prey, perhaps as a way to counteract the moth’s evasive tactic (Sillar et al., 2016). Moreover, to prevent moths from hearing their calls, a few bat species such as the Barbastella barbastellus use “quiet calls” (Sillar et al., 2016). Although these bats are only able to find their prey from a shorter distance, the fact that the echoes produced are loud enough for them to hear helps them in capturing moths that are oblivious to their dangerous presence.
Arctiid moths have the ability to make ultrasonic sounds using their tymbals, which are exoskeletal structures, when sensing the presence of a bat (Waters, 2003). There are three different theories that may explain this behaviour. The first theory suggests that this can surprise and confuse the bat, giving enough time for the moth to escape, but this appears to be true for bats that are naive. Another theory proposes that this is used to warn the bats that they are unpalatable or dangerous to them (Waters, 2003). However, the sounds for aposematic reasons would be used earlier on when the bats are still searching for their prey. The third theory states that the sounds are for crowding the echolocation calls of bats which disrupts their ability to use the echoes to determine their prey’s distance (Waters, 2003).
By observing the predation of bats on moths, echolocation and other techniques pertaining to sound waves and maneuvers are of an advantage for both the predator and the prey. This demonstrates that hunting and evasion strategies remain similar between these two species and whether the prey or predator will win the battle depends on timing, distance, and species-specific characteristics.
Honeybees versus Heavily Armored Hornets – Size Matters
Whilst discussions of inter-species arms races are often limited to physiological and morphological adaptations of a given pair, it is crucial not to omit the often equally, if not more, important role that behavioral adaptations play in balancing a given ecological niche. The Asian honeybee, Apis cerana, exemplifies this importance. Indeed, this species native to south-east Asia commonly falls prey to Vespa mandarinia, the largest known hornet. These hornets are not only much greater in size than the bees, but also present a thick cuticle which generally cannot be penetrated by the honeybee’s stinger (Gu et al., 2021). Thus, Apis cerana is entirely vulnerable to its common predator, that is, when acting alone. On the other hand, in large groups, the story is quite different.
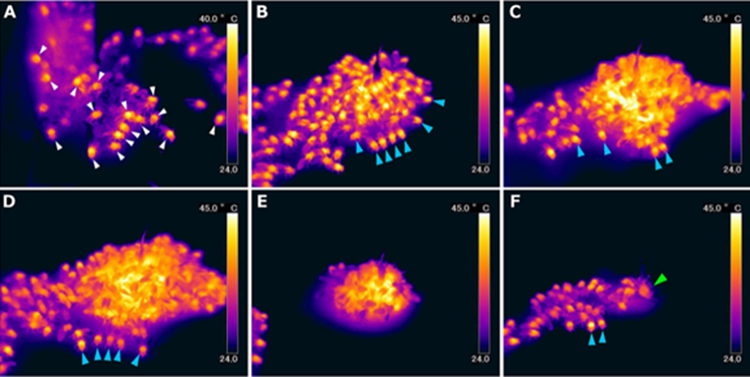
When a hornet approaches the nest too closely or begins to attack, the bees quickly engulf the predator causing the internal temperature of the ball in which the hornet is located to heat rapidly, reaching temperatures of up to 45.9 degrees Celsius (Sugahara & Sakamoto, 2009). As one might expect, it takes a significant number of bees to reach such temperatures, often more than 500 (Gu et al., 2021), although the rise in temperature occurs much faster than one might imagine: 424.3 ± 173.5 seconds (Hosono et al., 2017). In a study by the Hosono et al. (2017), the bees varied in terms of body temperature although the mean was at about 34°C. Moreover, the researchers noted that the guard-bees tended to have higher body-temperatures, suggesting that this defensive mechanism is ancient enough for some individuals of the colony to have begun to specialize in this function. Once the maximum temperature of the ball is reached, the bees persist in staying tightly grouped and maintain this temperature for approximately 1365.7 ± 729.8 seconds. Finally, the bees progressively break up and return to the colony, almost invariably leaving the hornet dead. Impressively, the bees come out unharmed, even those at the core of the heat-ball, as the lethal temperature for Apis cerana is approximately 50-51˚C (Sugahara & Sakamoto, 2009). The previously described steps can be seen in Figure 7.
Size and Thermodynamics
Whilst the heat-ball technique may result in the death of some honeybees due to the inevitable proximity of some to the hornet’s mandibles, the heat only kills the given Vespa mandarina. Some basic thermodynamics can help explain this phenomenon. At a fundamental level, heat exchange occurs according to surface area, whilst heat production occurs according to volume. However, the two are not linearly correlated. Indeed, as the length of a body increases, its surface area increases to the square, whilst its volume (a general proxy for mass) increases to the cube. Thus, as a species increases in length (L), the ratio of its surface area (L2) to volume (L3), or heat exchange surface to heat produced, becomes increasingly small (Epstein et al., 1983).
\lim\limits_{L→∞} {L^2\over L^3} = \lim\limits_{L→∞} {1\over L} = 0In more practical terms, this means that large arctic animals such as polar bears and narwhal can better retain heat due to their massive size, and reversely, are more prone to overheating. Unfortunately for Vespa mandarinia, in this analogy, it is the polar bear. As the honeybees engulf the hornet, the formers not only radiate more heat than an insect of comparable size to the hornet, but they also manage to maintain generally lower body temperatures due to their surface to volume ratio being less favorable to heat retention.
Whilst the differences in size between the hornets and the honeybees may not initially appear to be sufficient to warrant mention of thermodynamics, the length of the Asian honeybee and giant hornet are approximately 1.0cm and 3.50cm respectively, the same percentage difference in length between a 10cm long mouse and a 35cm medium sized dog. The calculations below are an approximation of the differences in thermal regulation.
Apis cerana : 1 {cm^2\over cm^3}Vespa\enspace mandarinia : {3.5^2cm^2\over 3.5^3cm^3} ≈ 0.29 {cm^2\over cm^3}Although these calculations are somewhat of an oversimplification of a specie’s ability to dissipate heat, it remains evident that whilst the Asian giant hornet may not have exactly 29% of the heat dissipating capabilities of its counterpart, Vespa mandarinia is evidently more susceptible to overheating.
The Role of CO2
This difference in size however does not appear to be the only factor contributing to killing the hornet. When subjected to temperatures of 47◦C in a controlled environment, often 1 to 2 degrees above the maximum temperature reached in a heat-ball, Vespa mandarinia can often survive for upwards of 10 minutes (Sugahara & Sakamoto, 2009). The primary difference between the controlled environment and that of the center of the heat-ball is the CO2 concentration. Indeed, as several hundreds of honeybees form a sphere of approximately 6cm in diameter (Sugahara et al., 2012), the concentration of CO2 rises to 3.6 ± 0.2% above the environment’s baseline concentration (Sugahara & Sakamoto, 2009). Although the reason why the lethal temperature drops as CO2 concentration increases is not entirely understood, we can hypothesize that the reason for this increase could be rooted in the fact that as body temperature rises, so does metabolic activity, and consequently, so does oxygen consumption. In human for instance, each increase of 1°C corresponds to an increase in oxygen consumption of 10-13% (Du Bois, 1921). While the specific data regarding metabolic consumption of Vespa mandarinia in regard to temperature does not exist, it can be presumed that increases in temperature also correlate with increases in metabolism in this species. The mechanism for this is quite simple. As heat is transferred into a system, Vespa mandarinia in this case, the heat increases the kinetic energy of the molecules undergoing metabolic processing in the animal, and as a result, increased oxygen is required to maintain these metabolic functions (Schulte, 2015). Unfortunately, the hornet will have great difficulty meeting these metabolic requirements due to the lesser availability of O2, and subsequently, the hornet will die earlier due to the coupled effect of metabolic disruption and lethal or near-lethal temperatures.
The importance of heat-balling
Heat-balling, whilst an extremely effective way to defend the hive against Asian giant hornets as well as other predators, is not infallible. A single Vespa mandarinia can kill as many as 40 honeybees/min (Ono et al., 1995) using its mandibles, meaning that a group of 30 giant hornets could decimate a large 30 000 honeybee hive in as little as 25 minutes. It is thus no surprise that Apis cerana developed such an “all or nothing” technique involving such vast numbers as the fate of the entire colony is literally at stake. It remains to be seen whether Vespa mandarinia will develop its own strategy to respond to the strong threat of heat-balling, leaving us to wonder how the honeybee population could further adapt, if at all, to an evidently much physically stronger opponent.
Electric eels versus Fish – Optimizing Electric Fields
Immobilizing prey through an electric shock is another means used by certain species for predation, in particular the electric eel. This fish has adapted overtime to stun its prey by inducing a 600 V discharge leading to muscle paralysis (Carlson, 2015; Catania, 2019).
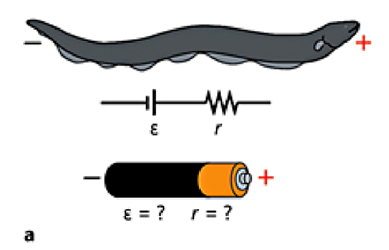
To generate a discharge, the fish’s brain sends a signal through its nervous system to either of the following organs: the Main organ, the Hunter’s organ or the Sach’s organ (Xu et al., 2021). These organs are filled with hundreds of electrocytes cells that stack on top of each other. At rest, the stacks are negatively charged on the inside and positively charged on the outside maintaining a negative resting potential in the organ. When the nerve signal arrives at the electrocyte, positive sodium ions flow into one side of the electrocyte, the potential is then reversed which causes the voltage to increase across the electrocyte. The voltage of all electrocytes within the organ summate and the organ acts like a battery (Carlson, 2015).
Figure 8 illustrates an analogy between a battery and the electric eels organ. Within the electric organ, polarized electrocytes are stacked on top of each other in series. This results in a complex that is very similar to how a modern-day battery operates, capable of generating a discharge up to 600V. On one hand, the battery is composed of many voltaic cells. On the other hand, the eels’ electrical organs are made up of the electrocytes that act as the voltaic cells and generate a potential difference. In both cases, the cells are placed in series and can add up each cell’s voltage. Therefore, the electrical organ acts as a biological battery in the wilderness (Carlson, 2015; Guha et al., 2021) .
Electric eels emit two electric organ discharges (EODs). Both are a 1 ms long monophasic pulses, where one discharge is stronger than the other (Catania, 2015; Xu et al., 2021). When the eel is in its environment, a low-voltage output is generated at a low rate: 10-20 Hz, this kind of discharge contributes to the electrolocation of the animal,i.e., detect the presence of other fish, detect prey or avoid predators. Whenever eels hunt their prey, they generate a second and stronger EOD at rates of up to 500 Hz. The higher rates EODs activate the prey’s motor neuron efferent and consequently muscles contractions are induced, which causes a short immobilizing tetanus in the prey allowing the eel to directly swallow it (Catania 2015, 2019).
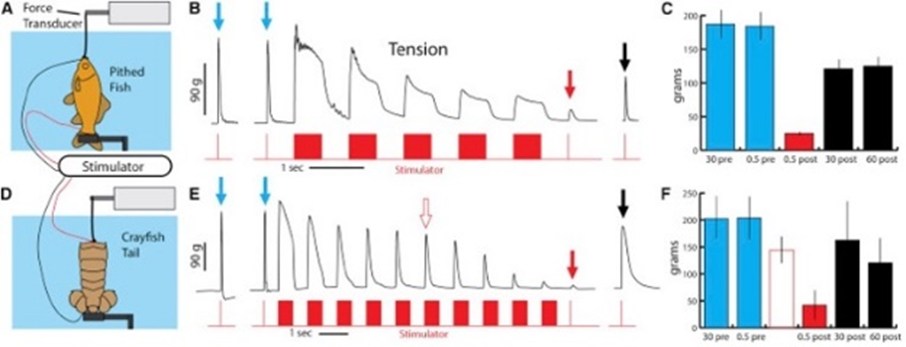
The immobilizing process is due to muscle contraction. The higher the rate of EODs, the more the prey’s muscles are going to contract, and the faster fatigue is induced in the prey (Catania, 2015).
In some prey species with a larger skin resistance, it might be necessary for the eel to generate higher rates of EODs. One example would be the crayfish (Figure 9). It has a tail which has higher resistance to electrical discharges (due to its higher ohmic resistance) (Catania, 2019).
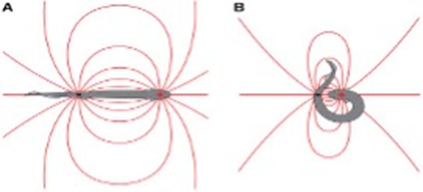
When Electrophorus electricus is confronted with larger fish or species with higher resistance, simply generating high voltage EODs might not be as effective as with smaller preys. That is why the animal uses what is called a dipole attack during which it curls up into a specific shape in which the two ends of the animal are brought together, sandwiching the prey in question around their electric organ (Carlson, 2015; Catania, 2015). This curling behaviour increases the power of the discharge when compared to an eel in its linear position (Catania, 2019). During a dipole attack, the electric field surrounding the animal changes. (Since the two poles are no longer separated in space, the positive and negative ends of the electrical organ do not act as point sources but rather the complex acts more like a line charge. Consequently, “Field strength falls more slowly with distance (d) from an idealized line charge (1 / d) compared to a point source (1 / d2)” (Catania, 2015).
As depicted in Figure 10, a fish located near the head of an eel in a linear position is going to feel further the effect of the positive end and almost practically no effect from the negative pole. Therefore, the resultant effect is going to correspond to the difference between the effects at each pole and the strength of the local field would be less strong. In a curled position however, the two effects are additive and this as a result doubles the intensity of the electric field felt by the prey (Catania, 2015). The curled position of the eel is also more effective at triggering high rates of continuous efferent activation which results in rapid attenuation of contractile force especially in prey with resistive skin (Catania, 2019). The dipole technique is another good example of adaptation in the eel which allowed it to get ahead in its arms race with fish it interacts with. Although very impressive, this kind of natural adaptation using electrical charges is found in more species than just the eel (Crampton, 2019).
Conclusion
Whilst much of the general public instinctively takes for granted the “fact” that predators and their associated prey invariably live at the expense of one another, each previous section covering a different predator-prey pair puts to question such an assumption. Indeed, the lion-zebra and cheetah-impala pairs highlight how closely correlated athleticism, ranging from muscle fiber composition to maneuverability, must be to maintain a natural habitat. The various aerial pairs, from the dragonfly-fruit fly to the bat-moth to the hornet-honeybee, further point to a remarkable stability between animals and their potential meal. The fruit fly, the moth, and the honeybee, regardless of their position in their habitat’s hierarchy, have evolved distinctive strategies best suited for their biophysical realities. The fruit fly’s flight patterns, the moth’s ability to modify sound waves, the honeybee’s strategy of cooking an attacker alive, all these examples, whilst anecdotal when analyzed separately, support the idea that even the most vulnerable are suited to exist alongside their predators as they are all biproducts of one another. Not to mention the eel-fish pair which the eel utilizes the principal of dipoles to more efficiently take advantage of its biological characteristics. All in all, this article can be considered as a point of reference in one’s exploration of the chaotic balance of life. From top to bottom of the food chain, all has evolved to fit together, despite the unavoidably fierce biological competition.
References
Carlson, B. A. (2015). Animal Behavior: Electric Eels Amp Up for an Easy Meal. Curr Biol, 25(22), R1070-1072. https://doi.org/10.1016/j.cub.2015.09.051
Catania, Kenneth C. (2015). Electric Eels Concentrate Their Electric Field to Induce Involuntary Fatigue in Struggling Prey. Current Biology, 25(22), 2889-2898. https://doi.org/10.1016/j.cub.2015.09.036
Catania, K. C. (2017). Electrical Potential of Leaping Eels. Brain, Behavior and Evolution, 89(4), 262-273. https://doi.org/10.1159/000475743
Catania, K. C. (2019). The Astonishing Behavior of Electric Eels [Review]. Frontiers in Integrative Neuroscience, 13. https://doi.org/10.3389/fnint.2019.00023
Combes, S. A., Rundle, D. E., Iwasaki, J. M., & Crall, J. D. (2012). Linking biomechanics and ecology through predator–prey interactions: flight performance of dragonflies and their prey. Journal of Experimental Biology, 215(6), 903-913. https://doi.org/10.1242/jeb.059394
Crampton, W. G. R. (2019). Electroreception, electrogenesis and electric signal evolution. Journal of Fish Biology, 95(1), 92-134. https://doi.org/https://doi.org/10.1111/jfb.13922
Dawkins, R., & Krebs, J. R. (1979). Arms Races between and within Species. Proceedings of the Royal Society of London. Series B, Biological Sciences, 205(1161), 489-511. http://www.jstor.org/stable/77442
Du Bois, E. F. (1921). The Basal Metabolism in Fever. JAMA, 77(5), 352-357.
Epstein, Y., Shapiro, Y., & Brill, S. (1983). Role of surface area-to-mass ratio and work efficiency in heat intolerance. Journal of Applied Physiology, 54(3), 831-836. https://doi.org/10.1152/jappl.1983.54.3.831
Goerlitz, H. R., Hofstede, H. M. t., & Holderied, M. W. (2020). Neural representation of bat predation risk and evasive flight in moths: A modelling approach. Journal of Theoretical Biology, 486, 110082. https://doi.org/https://doi.org/10.1016/j.jtbi.2019.110082
Gu, G., Meng, Y., Tan, K., Dong, S., & Nieh, J. C. (2021). Lethality of Honey Bee Stings to Heavily Armored Hornets. Biology, 10(6), 484. https://www.mdpi.com/2079-7737/10/6/484
Guha, A., Kalkus, T. J., Schroeder, T. B. H., Willis, O. G., Rader, C., Ianiro, A., & Mayer, M. (2021). Powering Electronic Devices from Salt Gradients in AA-Battery-Sized Stacks of Hydrogel-Infused Paper. Advanced Materials, 33(31), 2101757. https://doi.org/https://doi.org/10.1002/adma.202101757
Hosono, S., Nakamura, J., & Ono, M. (2017). European honeybee defense against Japanese yellow hornet using heat generation by bee-balling behavior. Entomological Science, 20(1), 163-167. https://doi.org/https://doi.org/10.1111/ens.12248
Howland, H. C. (1974). Optimal strategies for predator avoidance: The relative importance of speed and manoeuvrability. Journal of Theoretical Biology, 47(2), 333-350. https://doi.org/https://doi.org/10.1016/0022-5193(74)90202-1
Keeley, B. W., Keeley, A. T. H., & Houlahan, P. (2018). Ridge number in bat ears is related to both guild membership and ear length. PLOS ONE, 13(7), e0200255. https://doi.org/10.1371/journal.pone.0200255
Kobayasi, K. I., Hage, S. R., Berquist, S., Feng, J., Zhang, S., & Metzner, W. (2012). Behavioural and neurobiological implications of linear and non-linear features in larynx phonations of horseshoe bats. Nature Communications, 3(1), 1184. https://doi.org/10.1038/ncomms2165
Kruuk, H., & Turner, M. (1967). Comparative notes on predation by lion, leopard, cheetah and wild dog in the Serengeti area, East Africa. Mammalia, 31(1), 1-27. doi:10.1515/mamm.1967.31.1.1
Kuc, R. (2009). Model predicts bat pinna ridges focus high frequencies to form narrow sensitivity beams. The Journal of the Acoustical Society of America, 125(5), 3454-3459. https://doi.org/10.1121/1.3097500
Moebs, W., Ling, S. J., & Sanny, J. (2016). 17.7 The Doppler Effect. In University Physics Volume 1. OpenStax. https://openstax.org/books/university-physics-volume-1/pages/17-7-the-doppler-effect
Olberg, R. M., Seaman, R. C., Coats, M. I., & Henry, A. F. (2007). Eye movements and target fixation during dragonfly prey-interception flights. Journal of Comparative Physiology A, 193(7), 685-693. https://doi.org/10.1007/s00359-007-0223-0
Olberg, R. M., Worthington, A. H., & Venator, K. R. (2000). Prey pursuit and interception in dragonflies. Journal of Comparative Physiology A, 186(2), 155-162. https://doi.org/10.1007/s003590050015
Ono, M., Igarashi, T., Ohno, E., & Sasaki, M. (1995). Unusual thermal defence by a honeybee against mass attack by hornets. Nature, 377(6547), 334-336. https://doi.org/10.1038/377334a0
Reynolds, A. M., & Frye, M. A. (2007). Free-Flight Odor Tracking in Drosophila Is Consistent with an Optimal Intermittent Scale-Free Search. PLOS ONE, 2(4), e354. https://doi.org/10.1371/journal.pone.0000354
Schulte, P. M. (2015). The effects of temperature on aerobic metabolism: towards a mechanistic understanding of the responses of ectotherms to a changing environment. Journal of Experimental Biology, 218(12), 1856-1866. https://doi.org/10.1242/jeb.118851
Sillar, K. T., Picton, L. D., & Heitler, W. J. (2016). The Biosonar System of Bats. In K. T. Sillar, L. D. Picton, & W. J. Heitler (Eds.), The Neuroethology of Predation and Escape (pp. 106-139). John Wiley & Sons, Ltd. https://doi.org/https://doi.org/10.1002/9781118527061.ch5
Sugahara, M., Nishimura, Y., & Sakamoto, F. (2012). Differences in Heat Sensitivity between Japanese Honeybees and Hornets Under High Carbon Dioxide and Humidity Conditions Inside Bee Balls. Zoological Science, 29(1), 30-36, 37. https://doi.org/10.2108/zsj.29.30
Sugahara, M., & Sakamoto, F. (2009). Heat and carbon dioxide generated by honeybees jointly act to kill hornets. Naturwissenschaften, 96(9), 1133-1136. https://doi.org/10.1007/s00114-009-0575-0
Waters, D. A. (2003). Bats and moths: what is there left to learn? Physiological Entomology, 28(4), 237-250. https://doi.org/https://doi.org/10.1111/j.1365-3032.2003.00355.x
Wilson, A. M., Hubel, T. Y., Wilshin, S. D., Lowe, J. C., Lorenc, M., Dewhirst, O. P., Bartlam-Brooks, H. L. A., Diack, R., Bennitt, E., Golabek, K. A., Woledge, R. C., McNutt, J. W., Curtin, N. A., & West, T. G. (2018). Biomechanics of predator–prey arms race in lion, zebra, cheetah and impala. Nature, 554(7691), 183-188. https://doi.org/10.1038/nature25479
Xu, J., Cui, X., & Zhang, H. (2021). The third form electric organ discharge of electric eels. Scientific Reports, 11(1), 6193. https://doi.org/10.1038/s41598-021-85715-3