The Gravity of Connectivity in Migratory Birds During a Climate Emergency
Taymour Elgamal, Trina Fearon, Karim Mustafa
Abstract
All populations form networks which describe their interactions, mixing and mating. Migratory populations also form networks, but these are much more complex because of the continuously migrating populations throughout the seasons. Migratory networks are more fragile but are a fundamental pillar to bird populations. They can aid populations but can be the source of negative outcomes under certain conditions. We investigate its significance during climate change which has caused many troubles to birds such as habitat loss, pathogen spread and shifts in migratory timing. It was shown that these networks can reduce population decline, they also are important in predicting pathogen spread, and bioengineering methods could take advantage of our understanding of pathogen spread through connectivity to take action. Finally, climate change makes seasons longer which alters connectivity and can affect which birds get to breeding grounds first. Mathematical models are a great tool to analyze these networks and this article attempts to do so with them
Introduction
Species of birds form populations that migrate together and share their grounds throughout seasonal changes. The interactions or mixing within and between these populations is standard and occurs for most populations (Norris and Taylor, 2010). In this context, interactions can refer to mating, migrating together, or simply living alongside another individual and sharing this common ground (Xu et al., 2019). These actions form migratory networks and can be analyzed using mathematical models to understand their impact on bird species, and also to understand how they are influenced and by what.
It is important to note that migratory networks are very different from networks formed by metapopulations (Norris and Taylor, 2010). Metapopulations relatively do not change location, the same way that Montrealers do not change location because they live in Montreal, and a city does not move. This means that these networks change by the entering and exiting individuals and are easier to evaluate than migratory networks. Migratory networks also have individuals that enter and exit, but the entire population changes location seasonally which complicates the dynamics of the network (Norris and Taylor, 2010). In this article, we try to shed a light on the movement and network of migratory birds and how it correlates to many factors such as habitat loss, migratory timings and pathogen spread throughout these populations.
Lastly, it is noteworthy to mention that climate change has shifted these phenomena, and we need to reevaluate how it does so. This article suggests that the complexity of migratory movements and networks is fundamental to the survival of bird species and can give an edge to birds during climatic challenges or epidemics. On the flip side, if these support systems collapse, it suggests that these populations may struggle as a result. These concepts are explained in the article using mathematical models as a tool to measure and understand migratory bird populations.
The importance of connectivity in the aftermath of habitat loss
Migratory bird populations occupy different sites throughout the year: breeding, wintering and stopping sites. Breeding sites are their main habitats, located mostly in the Northen hemisphere, whereas wintering sites are south of breeding sites and act as a refuge site to escape the cold. Lastly, their stopping sites are located in between the two former sites and are temporarily occupied during migration (Norris and Taylor, 2010). Bird species also occupy different regions of a country or continent and the mixing that occurs between the birds that populate these different regions and/or sites was described above as networks but can also be understood as their connectivity.
Migratory networks are very fragile, yet they are indispensable to migrating populations. This is due to the fact that migrating populations have an increased flow of entering and exiting individuals, especially during migrating seasons (Norris and Taylor, 2010). On top of this, migratory networks exist at many locations for the same population of birds. Therefore, their networks are not as grounded as those of other populations – the dynamics involved are more complex. A frail network within a population can put its survival in danger, but these networks also have the power of uplifting struggling populations (Norris and Taylor, 2010). The following explores how migratory networks affect migrating populations which can only be thoroughly understood under a mathematical lens.
When a habitat is lost to a population of migrating birds, connectivity is undoubtably affected. The best-case scenario is that there is a massive increase of connectivity. This means that this former population has joined another that lives in a different region, and it was observed that this occurrence maintains population size and the expected population drop does not occur (Norris and Taylor, 2010). If a population of birds lives in a region that is centralized (surrounded by other populations in nearby regions), then the population decline will be even less noticeable if this population loses its habitat (Norris and Taylor, 2010). However, if this same population lives at the extremity of its species' migratory network and its habitat is lost, it becomes harder for this population to join the rest of its species. This can lead to segregation, where this population finds a new habitat but is completely isolated from remaining network of its species, which eliminates connectivity between that population and the others (Norris and Taylor, 2010). This scenario is very dangerous for a population and can lead to serious decline, and even local extirpation. This is why the Bicknell's thrush is currently an endangered species (Norris and Taylor, 2010). Its populations are scattered and isolated, which has made the species very vulnerable to unexpected pressures like climate change, or other climatic issues. There are even pernicious long-term effects for this scenario, in that if the chance of reintegration becomes possible again for this population, it might not occur if too much time passed due to several generations of adaptation (Norris and Taylor, 2010).

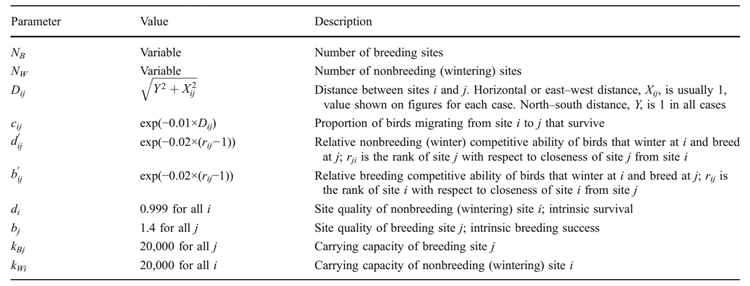
However, Norris and Taylor (2010) have shown that these cases aren't doomed, as long as connectivity can be reestablished. Sometimes networks can reform because individuals from distant populations choose to migrate to the isolated one. This occurs because there is less competition within isolated populations then there is for others (Norris and Taylor, 2010). Norris and Taylor (2010) confirm that this scenario isn't a rare occurrence either, as long as the death rate of migrating birds to the isolated region is not too high. Norris and Taylor have formed a model to describe how connectivity affects population migration. Beyond the numerous equations involved, it is relevant to identify the variables that must be taken account for when making these models and is given by the following table 2. Mainly, it is important to be aware of the number of sites- that is breeding, wintering, and stopping. The change in population which derives from births and deaths are also required to be listed to ensure that these aren't misinterpreted as migrating birds from other populations. Lastly, the distances between all sites are important to determine how even the distribution is throughout sites, a concept explained in the following paragraph.
Lastly, the shape of the network is also important. This means if a network is spread thin throughout a large area, it will not be nearly as efficient as a buffer to population decline. Similarly, an even distribution is also statically favorable because it reduces the risk of isolation from a particular site. The Dunlin species is an amazing real-world example of this, because their migratory network is very evenly distributed across its breeding and nonbreeding grounds around the world (Norris and Taylor, 2010). This means that different populations have consistent distances between their seasonal sites and that the mixing and interactions between and within populations is also relatively constant throughout its populations (Norris and Taylor, 2010). Since this species is found worldwide, and not all populations interact, these populations are said to have “parallel migration systems” (Norris and Taylor, 2010). This system is very advantageous for a species that is evenly distributed, because it encourages more connectivity after habitat loss. Nonhomogeneous networks, however, are more susceptible to population decline, and are also commonly observed in the real world. In this case, nonhomogeneous networks refer to a distribution of migratory sites that are irregular in their distance from one another (Norris and Taylor, 2010). More specifically, the energy required to migrate to one of these sites is not constant. This is the case for the Bicknell's thrush mentioned above – its network was unevenly distributed and resulted in more population isolation over time.
As mentioned, climate change is causing an increase to habitat loss, and an important habitat for many bird species are wetlands. In East-Asia, these territories have been decreasing for a few decades. A study was performed by Xu et al. (2019) on 8 bird species to investigate how connectivity has affected these population sizes throughout the aftermath.
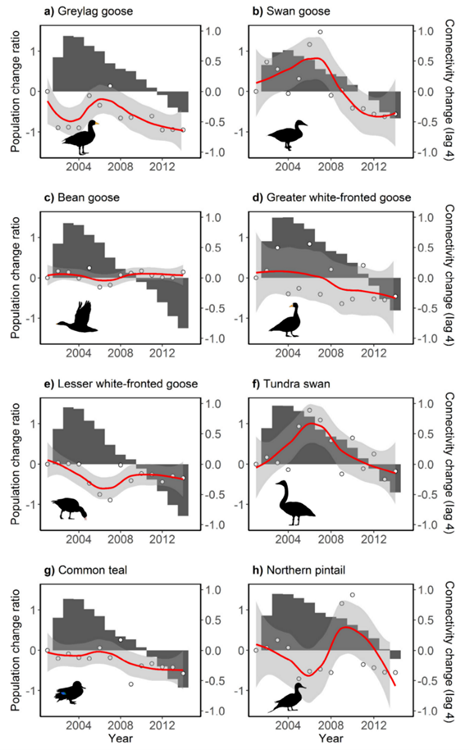
Functional connectivity, explain by Xu et al., is a measure that is related to the dispersion of a species over a certain area – it can describe if a population of birds is tight knit or scattered over a large area. The study also mentions how functional connectivity can affect the success of migration and of population rates. In figure 3 taken from the study, it can be observed for most species that population size follows connectivity of migratory networks. The connectivity decreases over years and a continuous decrease in population size was observed after the fact. Moreover, Xu et al. (2019) mention that there can be “up to a 4-year lag” in the trends of population size following the loss of connectivity. This is another example of the severity of collapsing or isolating populations. Lastly, Xu et al. Investigated any possible correlation with other factors such as “body mass, breeding range size, clutch size (the average number of eggs laid per female), generation length, migratory dispersion, and migration distance.” They found no correlation between these factors and change in population size, suggesting the significance of connectivity in migratory species. Overall, context and environment are very important in predicting how connectivity patterns will react to a habitat loss, but most importantly show how these networks are the pillars of healthy bird population sizes.
Avian migrations and pathogen spread
In this section we will try and demonstrate how bird migration network are correlated to the spread of pathogens, primordially viruses. A better understanding of the spatial distribution of these pathogens can help scientists avoid the outbreak of these viruses and ultimately avoid emergences of pandemics in both livestock and humans, or at least improve surveillance and risk assessments.
To do so we will study the case of avian influenza viruses, which are viruses that have always been present in wild birds, especially in waterfowl (ducks, geese etc.). However, as we know, these birds are migratory birds, and one can safely assume that the migration of infected birds must have a certain impact on the spread of the virus.
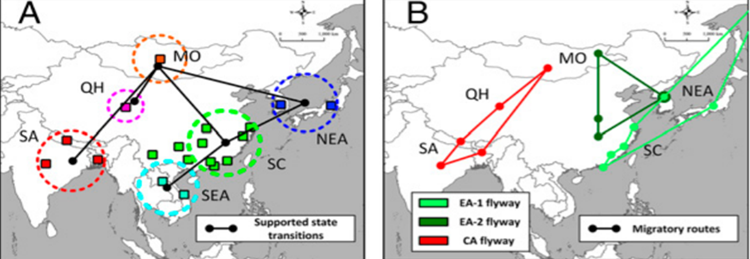
A study conducted across Asia by Tian, H et al. (2014) on a specific strand of the virus H5N1 (Avian influenza) provided very interesting insight on the correlation between the viral transmission network and the bird's migratory network. By compiling phylogenetic data on H5N1, and GPS data on 4 major waterfowl migratory birds (bar-headed goose, Swan goose, ruddy shelduck and northern pintail), they were able to construct a Viral network for H5NI (Figure 4A) and a migratory route network for the 4 birds in question (Figure 4B). If we compare the two figures, we can clearly see that the two networks seem to be overlapping with each other, which suggests that the gene flow of the virus is directly affected by the flyways of the infected birds.
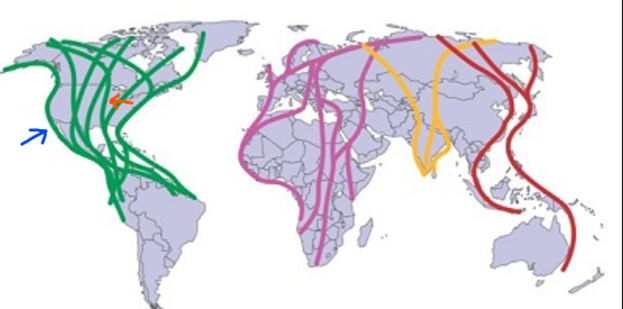
However, this does not give us enough insight on the spatial distribution of avian viruses, since we know that the flyway affects the flow of the virus, but we don't know in which way yet. Or more importantly we don't know if the viruses spread better in between or within migratory flyway. In order to determine this, we can calculate the transition rates of the virus alongside the migratory routes of different infected birds and try and determine if a pattern emerges; this is precisely what was done by Mathieu Fourment et al. with wild bird all across the American continent in figure 5.
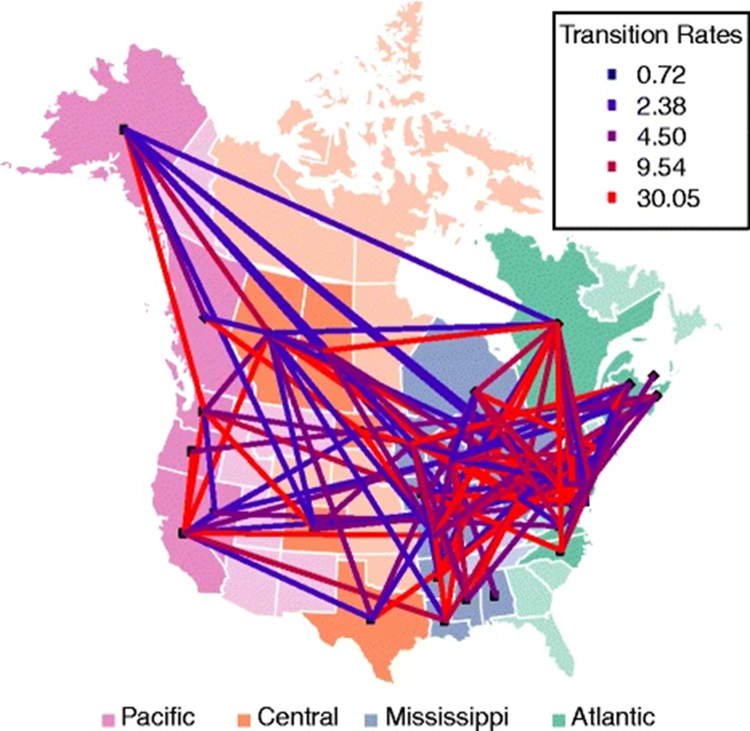
In figure 5, we can see that the highest transition rates of the virus in North America (30.05) are located in areas of very heavy flyway traffic, for example from southern Mississippi to Northern Atlantic, furthermore in areas of little flyway traffic like for example in the north of central America, the transition rates are the lowest (0.72). These observations strongly suggest that virus spread is significantly higher within flyways than in between them, which goes to show the importance of understanding these intricate migratory networks of birds in order to be able to predict and take measures towards up-and-coming diseases.
Arrival times and climate change
Nature works in cycles, actions triggering responses in a complex web of loops. Intrinsic to this is the passage to time, which brings about periodic changes in the world's workings. This is explained in phenology, the study of periodic events in biological life cycles as they are influenced by seasonal changes in climate. The complexity of the web connecting time, climate, environment, and species requires mathematical modeling to untangle. Phenology has been drawing attention due to the warming of the climate, as the fluctuations in climate reveal how the schedule of biological systems responds. In the mathematical world, migratory birds are a perfect subject to analyze. They compete for a limited number of territories on their breeding grounds, and their young are raised on a resource limited by time of year (Johansson and Jonzen, 2012).
To understand how the timing of arrival affects migratory birds, researchers Johansson and Jonzen created a game-theory approach with the aim of investigating how the evolutionarily stable strategy (ESS) is affected by changes in when spring begins, which thus affects the timing of resource peak and the length of the season (Johansson and Jonzen, 2021). The Evolutionarily stable strategy is the strategy adopted by a species with no better feasible alternative if enough members of the population adopt it. In this strategy, the best strategy for the individual depends on the strategies of other population members. Their approach was to compare the arrival dates when there is maximal environmental optimization (Johansson and Jonzen, 2012).
To do this they took the time variable x and restricted it by variables of the beginning and end of the season, xb
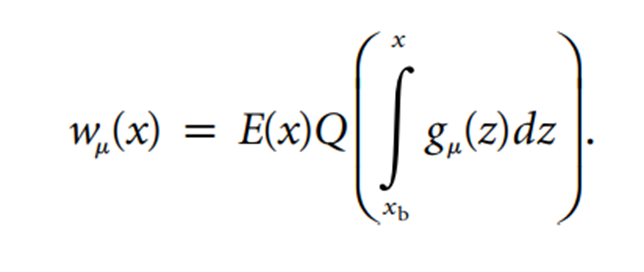
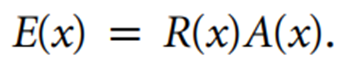
The number of offspring produced by a bird in an arbitrary territory, wµ(x), is shown to be equal to a number of variables (Johansson and Jonzen, 2012). The reproductive output in a territory for a bird with arrival date x is given by the imbedded equation E(x), while Q shows the quality of the territory (Johansson and Jonzen, 2012). The mean arrival date is noted by µ, and gµ shows its distribution (Johansson and Jonzen, 2012).
This equation can be varied to show how changes in territory and invading strategy. An ESS requires individuals that arrive later to have an equal reproductive rate to those who arrive earlier (Johansson and Jonzen, 2012). The general characteristics of this ESS can show the effect of changes within degree of competition and arrival distribution.
Modelling shows that climate change increases season length, therein advancing ESS phenology, while leaving the environmental optimum unchanged.
The white stork, Ciconia ciconia, can be used as an example to examine these relationships. The elegant bird has had data recorded at its Slovakian nesting site since 1880, pre-climate change, and spends its winters around Western Africa (Berthold et al, 2000). Applying game-theory modelling to its case is interesting because its population has been declining at worrisome rates, and because it demonstrates protandry. Protandry describes the pattern of males arriving at breeding sites prior to females.
A group of Polish researchers aimed at understanding the effect of complex phenological changes on the breeding success of white stork. They created linear regression models and, most notably, found that temperature increases in winter migratory destinations lead to later arrivals at breeding grounds (Gordo et al, 2013).
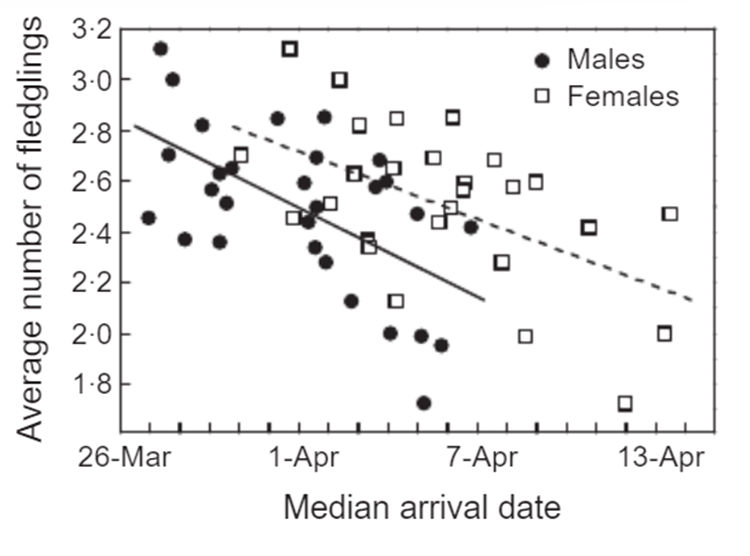
The most remarkable finding from this analysis is that the median arrival date, whose shift can be explained by Johansson and Jonzens' work, has resulted in a clear decline in reproductive success. There is also a 30% reduction in protandry, overriding the valuable reasons that lead to its evolution.
Conclusion
Migration creates an ebb and flow of populations, and results in changes to complex systems. Using powerful mathematical tools, these connections can be mapped out and modelling. This proves particularly useful to understand how the changing climate affects the lives of migratory animals. Migratory animals create vast networks, and the loss or alteration of a habitat can be devastating. Likewise, the alteration of temperature can impact an array of aspects of a bird's migration. The networks that allow us to understand habit loss and migration also play a key role in analyzing how pathogens spread throughout mobile populations. All of this sums up to show how valuable math can be in conservation efforts for migratory species, providing valuable insight along the way.
References
Berthold, Peter et al. “White stork (Ciconia ciconia) migration studies: Basic research devoted to conservation measures”. Global Environmental Research vol 4(2) (2000): 133-141.
Fourment, M., Darling, A.E. & Holmes, E.C. The impact of migratory flyways on the spread of avian influenza virus in North America. BMC Evol Biol 17, 118 (2017). https://doi.org/10.1186/s12862-017-0965-4
Gordo, Oscar et al. “Complex phenological changes and their consequences in the breeding success of a migratory bird, the white stork Ciconia ciconia.” The Journal of animal ecology vol. 82,5 (2013): 1072-86. doi:10.1111/1365-2656.12084.
Johansson J, and Jonzén N. “Effects of Territory Competition and Climate Change on Timing of Arrival to Breeding Grounds: A Game-Theory Approach.” The American Naturalist, vol. 179, no. 4, 2012, pp. 463–74., doi:10.1086/664624.
Norris, R.; Taylor, C. 2010. “Population Dynamics in Migratory Networks.” Theoretical Ecology 3 (May): 65–73. https://doi.org/10.1007/s12080-009-0054-4.
Tian, H.; Zhou, S.; Dong, L.; Van Boeckel, T. P.; Cui, Y.; Wu, Y.; Cazelles, B.; Huang, S.; Yang, R.; Grenfell, B. T.; Xu, B. Avian Influenza H5N1 Viral and Bird Migration Networks in Asia. Proc. Natl. Acad. Sci. 2014, 201405216. https://doi.org/10.1073/pnas.1405216112.
Xu, Y., Y. Si, Y. Wang, Y. Zhang, H.H.T. Prins, L. Cao, and W.F. de Boer. 2019. “Loss of Functional Connectivity in Migration Networks Induces Population Decline in Migratory Birds.” Ecological Applications 29 (7). https://doi.org/10.1002/eap.1960.