Mathematical Modeling of Animal Tongues
Shunyuan Xiao, Marc Srour, Sophie Allard
Abstract
Mathematical modeling of animal tongue functions has improved the understanding of the animal kingdom and how species have evolved to efficiently perform tasks necessary for their survival. The chameleon can rapidly project its tongue, achieving large extension distances due to energy storage within the geometric structures of their tongues. This behavior can be modeled mathematically and serve as inspiration for the development of a meta-heuristic algorithm to solve optimization problems in engineering design. Similarly, bee tongues and their functions in fluid transport for feeding can be understood through geometric models. While these species can efficiently use their tongues to obtain nectar from flowers, this mechanism is associated with significant nectar leakage, which can be modeled mathematically. Hummingbird tongues have evolved to efficiently extract nectar from flowers through a capillary siphon mechanism, which can be modeled through geometric analysis of the tongue structure and functions of pressure drops and energy intake rates. Essentially, as mathematical advances improve our ability to model and understand the world around us, more insight can be gained on animal behavior and interactions in the animal kingdom.
Introduction
Mathematical models are often developed to describe behaviors and interactions in the animal kingdom. Through the process of modeling, researchers can transform a set of experimental data into formulas or other mathematical tools to describe and predict animal behavior. These models can also serve as unique tools for solving problems in a variety of applications, notably engineering design. The accuracy of such models, particularly when dealing with animal behavior, or in this case, animal tongue functions, is largely dependent on the information collected and used to build the model. The size of the animal sample must be large enough and representative of the population for the model to be generalized to the entire species.
In this paper, mathematical models of animal tongue functions in feeding, notably chameleon tongue projection and nectar extraction in bees and hummingbirds, are presented and analyzed. These models help scientists gain a deeper understanding of the mechanisms behind different functions of the tongue observed in the animal kingdom and allow further interpretation of nature's ingenious design solutions to problems facing species through evolution.
Mathematical modeling of chameleon tongues during projection
Chameleons are truly remarkable creatures with countless interesting biological features (Fig 1). They possess impressive color-changing abilities and are known for their fast and efficient prey-catching potential through rapid telescopic tongue extension (de Groot & van Leeuwen, 2004). A growing body of research investigating the biomechanics behind a chameleon tongue's ballistic projection is emerging; however, the mathematical behavior of tongue extension has not been investigated until recently (Moulton et al., 2016). This section of the paper will focus on outlining and analyzing a mathematical model of tongue extension in chameleons, as well as an interesting engineering design solution inspired by the species' unique behavior.
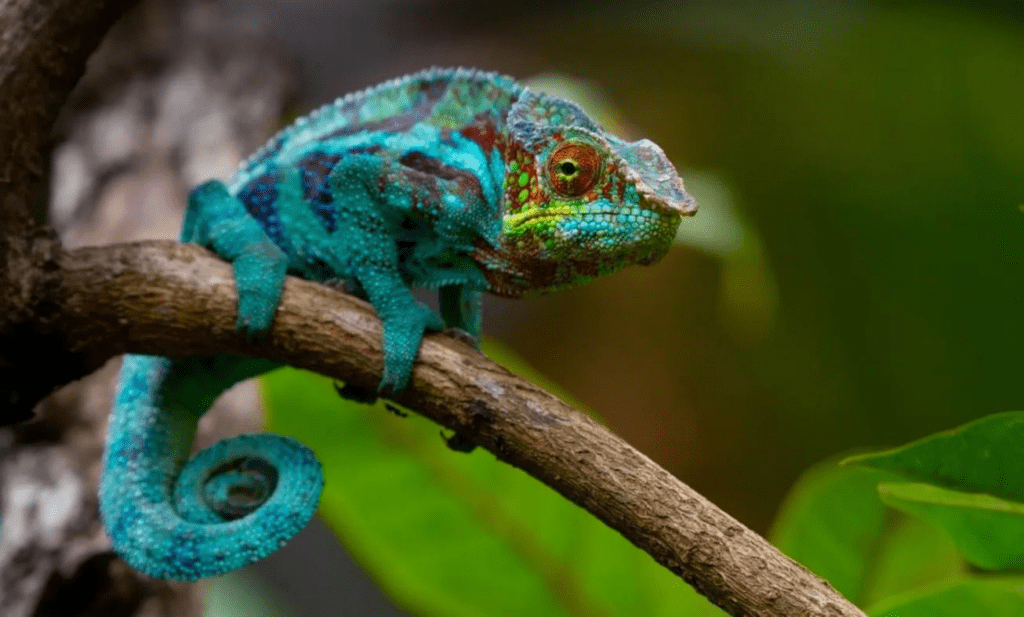
Fig. 1 Photo of a chameleon (Rafferty, n.d.).
Geometric overview of chameleon tongues
The chameleon tongue can be modeled by three main elements for the sake of mathematical projection analysis (Fig. 2). The tongue complex consists of the entoglossal process (central bone with radius ρ), and n concentrically stacked intralingual sheaths. These sheaths play a vital role in projection and are composed of fibers arranged in helices making an angle ϕ with the circumference of the cylindrical sheath (Fig. 2). Before projection begins, when the tongue is in the rest position, the inner sheath radius ai is equal to the entoglossal process radius ρ , as the intralingual sheaths simply rest on the bone (Moulton et al., 2016). Consequently, the inner sheath radius in the loaded state ãi is also equal to the bone radius. Once the tongue complex leaves the bone as projection begins, the inner radius Ai is smaller than ρ and is changing with respect to time (Moulton et al., 2016).
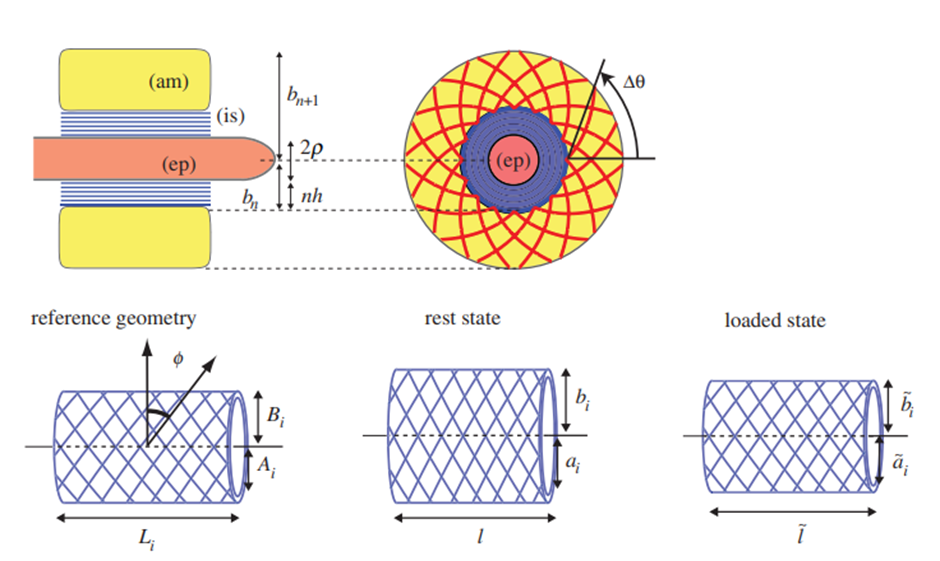
Fig. 2 Illustration of the tongue complex and the intralingual sheaths (Moulton et al., 2016).
Surrounding this tongue complex is the accelerator muscle, which can be characterized by the logarithmic spiral arrangement of its collagen fibers (Moulton et al., 2016). The tightness of these fibers, as illustrated in Figure 2, is measured by the angle θ from the horizontal starting at the base of the fiber. The outer sheath radius also represents the inner radius of the accelerator muscle and is denoted Bi. Table 1 outlines the key parameters that will be used to model chameleon tongue behavior and base values corresponding to Trioceros jacksonii, which were either collected from literature or deduced from images (Moulton et al., 2016). Based on the geometric model in Figure 2 and the parameters in Table 1, a mathematical model of tongue behavior in projection can be constructed.
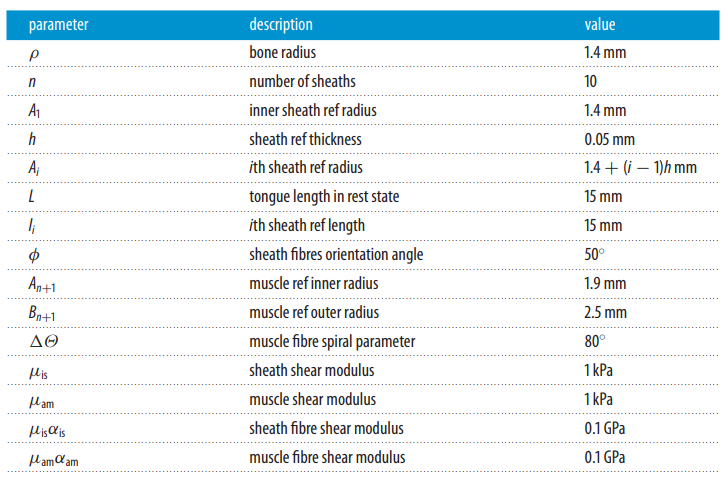
Table 1 Parameter values for Trioceros jacksonii used to model chameleon tongue projection (Moulton et al., 2016).
Mathematical model of tongue projection
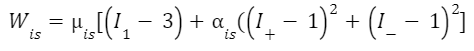
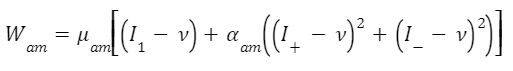
Chameleon tongue projection is powered primarily by elastic strain-energy release (as seen in: A Biomechanical Review of Animal Tongue Functions). To better understand this mechanism and apply it to engineering design problems, researchers from the Mathematical Institute at Oxford University have developed a model for the elastic strain energy stored before projection (Eq. 1) (Moulton et al., 2016). The model reveals that elastic strain energy depends on both the energy density of the intralingual sheaths (Wis) and the energy density of the accelerator muscle (Wam). Further, the energy density of the sheaths depends on both the inner radius (Ai) and the angle of the collagenous fibers (ϕ ). The energy density of the accelerator muscle depends on the muscular contraction in the logarithmically arranged fibers (v). This equation illustrates that tongue projection in chameleons is powered both by muscular contraction in the accelerator muscle and by strain in the network of intralingual sheaths, which is consistent with the hypotheses of many kinematic studies (de Groot & van Leeuwen, 2004; Anderson, 2016).
More specifically, equation 1 calculates the energy stored in each ring section of the tongue complex through integration and extends this to the entire cylinder by multiplying the result by 2πζl , where 𝜁
is the axial extension (length of complex in loaded position over length in rest position).
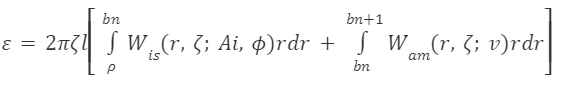
Equation 1 Elastic strain-energy function depends on functions of energy density in the intralingual sheaths (Wis) and the accelerator muscle (Wam). Variables are defined in Table 1 and Figure 2 above (Moulton et al., 2016).
The above equation contains the functions Wis and Wam. Therefore a model of energy density in both these regions must be developed to fully understand and analyze the energy storage and how this is used to power tongue projection (Eq. 2, Eq. 5). Based on experimental data and observations of chameleon tongue projection, researchers concluded that these energy densities can be described by fiber-reinforced strain energy-density equations (Moulton et al., 2016). While the derivations of these functions are slightly beyond the scope of this paper, the functions can still be understood.
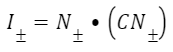
Equation 2 Energy density of the intralingual sheaths (coefficients µ and α are defined in Table 1 and parameters I are defined below) (Moulton et al., 2016).
This function contains parameters I, which are defined in terms of the Cauchy-Green stretch tensor C and the orientation of the intralingual sheath fibers M. The Cauchy-Green stretch tensor is a matrix containing information about the stretches of the fibers (Moulton et al., 2016). The trace of this matrix, defined as the sum of the diagonal entries of the matrix, is used to define I1 (Eq. 3). M± describes the orientations of the sheath fibers (Eq. 4). Therefore, I± combines parameters M and C to model the stretches in each fiber orientation (Eq. 5).
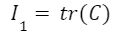
Equation 3 Equation of fiber stretches (Moulton et al., 2016).
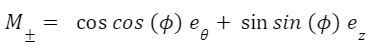
Equation 4 Equation of the orientation of fibers in the intralingual sheaths. 𝑒𝜃 and 𝑒𝑧 in this case are referring to the basis of the cylindrical coordinates (𝑒𝑟, 𝑒𝜃, 𝑒𝑧) (Moulton et al., 2016).
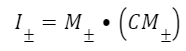
Equation 5 Equation of the stretches in the direction of the fibers in the intralingual sheaths (Moulton et al., 2016).
Given these three equations, the sheath energy density function can be further understood. The energy stored in the concentrically stacked sheaths increases with increased stretches or deformations of the fibers in various directions (Moulton et al., 2016). Similarly, the energy density in the accelerator muscle can be modeled by the equation with Wam (Eq. 6). This function includes contributions to energy by stretches of muscle fibers, as in the sheaths, but also shows an energy contribution through muscular contraction v (Moulton et al., 2016).
Equation 6 Energy density in the accelerator muscle (Moulton et al., 2016).
Since the fibers are arranged in logarithmic spirals instead of helices in the accelerator muscle, a different value of I± must be used in this case (Eq. 7). This value is calculated in a similar way to the value for the sheaths; however it depends on 𝑁, which corresponds to the spiral orientation of the muscle fibers (Moulton et al., 2016).
Equation 7. Equation of the stretches in the direction of the fibers in the accelerator muscle (Moulton et al., 2016)
To summarize, the energy density in the intralingual sheaths and the accelerator muscle before projection can be modeled using the fiber-reinforced strain-energy density function (Eq. 2 and 6) (Moulton et al., 2016). Using these functions, a model for the total strain energy stored in the system to power projection was developed (Eq. 1). This model not only allows an enriched understanding of the tongue projection mechanism used by chameleons but could also be used to derive values for the velocity reached by chameleon tongues during projection and the force exerted on the tongue complex (Moulton et al., 2016). By modeling this foraging behavior, researchers have gained a deeper understanding of how chameleon tongues have evolved to facilitate the survival of the species in the animal kingdom.
Chameleon Swarm Algorithm for optimization in engineering design
The evolution of chameleons' unique foraging strategies has allowed them to effectively catch their prey. Mathematical models of chameleon foraging behaviors, such as the one discussed above, have sparked an investigation of how this knowledge can be applied to engineering design problems. Through this investigation, the meta-heuristic Chameleon Swarm Algorithm (CSA) was developed (Braik, 2021). In general, meta-heuristic algorithms are designed to solve optimization problems, such as those required for engineering design, medical imaging, signal processing, urban development and many other scenarios (Abualigah et al., 2022). These techniques aimed to avoid the computationally complex traditional optimization methods, which would be particularly useful when dealing with complex engineering design problems (Abualigah et al., 2022).
The Chameleon Swarm Algorithm (CSA) incorporates many aspects of chameleon behavior in the search for food in order to find solutions to optimization problems (Braik, 2021). This algorithm is based on models of chameleon position in the search for prey, models of the rotation of their eyes to visually locate prey, and their method of prey-catching through rapid tongue projection (Braik, 2021). Through a combination of these mathematical models, a comprehensive model of chameleon foraging behavior was developed, in which the best solution to the algorithm is the best global position of the prey being hunted by the chameleon (Braik, 2021). As such, this algorithm can solve optimization problems related to engineering design, which is a very useful application.
Mathematical modeling of bee tongues for fluid transport
Honey bees, Apis mellifera ligustica, are flower-visiting insects that rely primarily on nectar as their food source (Sun et al., 2021). They use their highly specialized tongue to extract the precious nectar contained in certain types of flowers called nectariferous (Wang et al., 2022). With rhythmic protractions and retractions as well as a hairy outer structure, the bee's tongue can accumulate not the maximum amount of nectar, but the amount that composes a middle ground between nectar intake and energy expenditure (Wang et al., 2022). In this section of the paper, the lapping-sucking feeding technique of these bees will be explored through mathematical analysis.
Anatomy of a bee's tongue
A bee's mouthpart is separated into three subparts: two galeae, a pair of labial palpi and a glossa (Fig. 3) (Shi et al., 2020). One of the main differences between species of bees is located in the glossa, where size, number and shape are highly variable. Some species, like the orchid bee Euglossa imperialis have unusually long proboscises that can measure up to the specimen's body length (Shi et al., 2020). The proboscis is the organ that is made up of the three parts mentioned above. The central glossa is encased in a food canal formed by the two galeae and labial palpi (Shi et al., 2020).
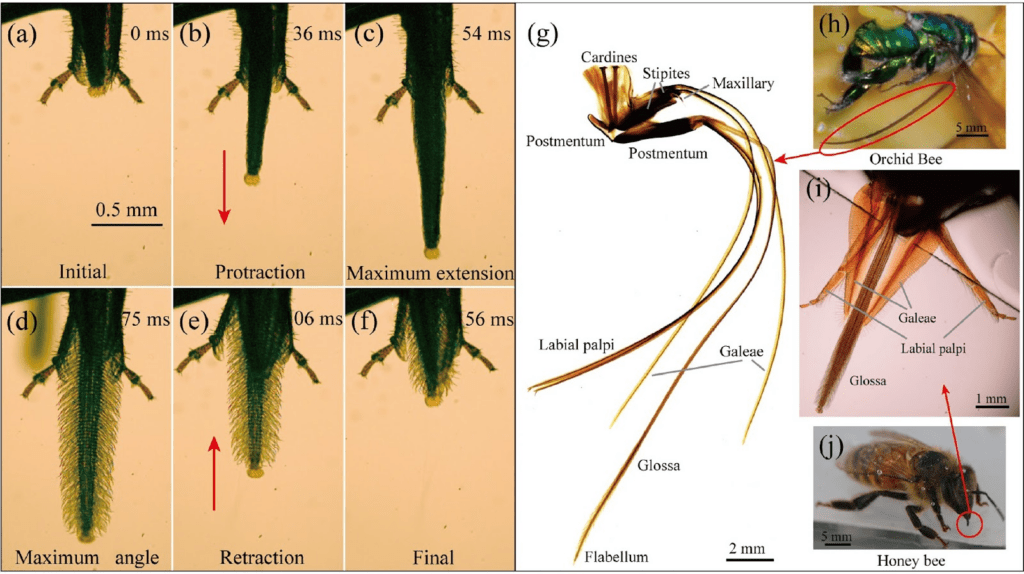
Fig. 3 (g) Bee tongue anatomy close-up, (h) Glossa of orchid bee Euglossa Imperialis , (i) three main parts of a bee's tongue (j) Honeybee Apis mellifera ligustica ‘s glossa (Shi et al., 2020).
The tongue is coated with thousands of dense hair-like structures (Fig. 4) (Sun et al., 2021). These hairs can erect, which helps with nectar intake volume since they can glean nectar more efficiently (He et al., 2021). The tongue protracts and retracts with a single muscle (He et al., 2021). When this muscle is retracted, the hairs situated on the glossal sheath lay flat, while the glossal sheath itself is compressed. This enables the structure as a whole to hold elastic energy. However, when the retractor muscle takes back its original elongated position, the tongue is protracted into the flower with the stretching of the glossal sheath accompanied by a simultaneous erection of the hairs (He et al., 2021).
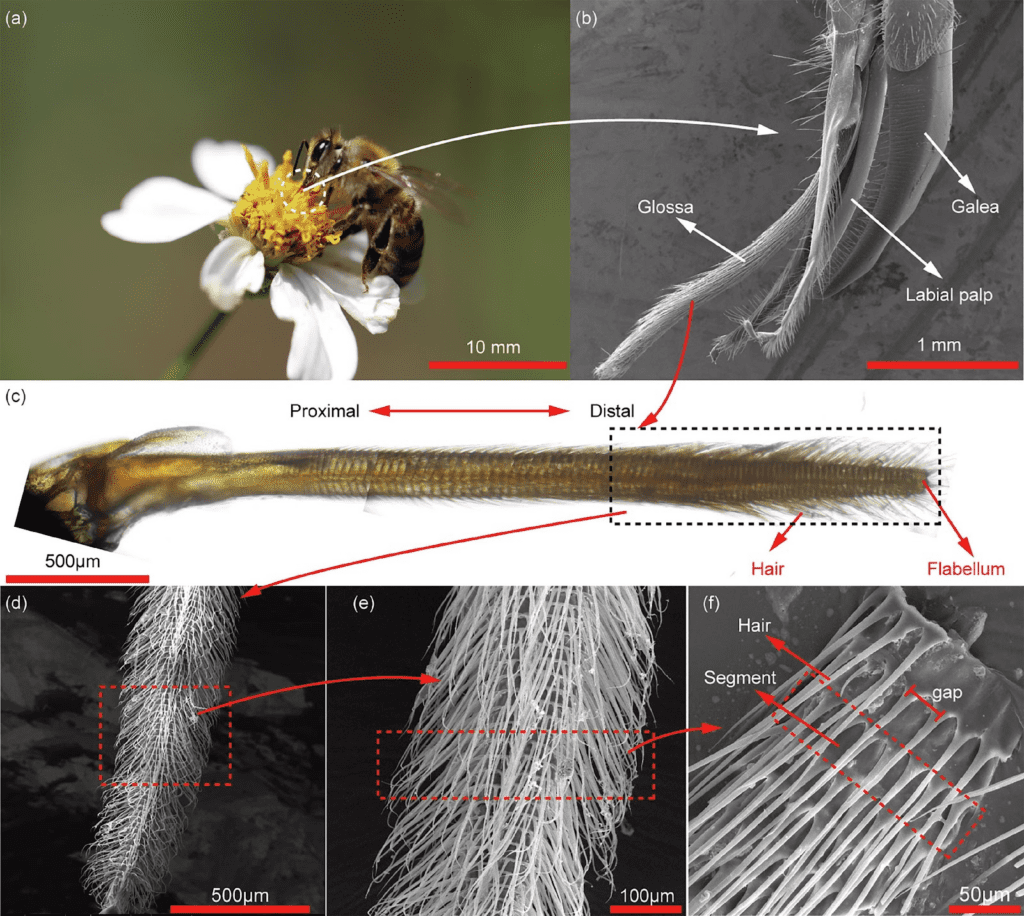
Fig. 4 (a)(b)(c) Tongue of a honeybee and zoom on the hairy structures located on the glossa (He et al., 2021).
While reaching out to extract nectar from flowers, a bee's tongue can elongate by 20% (Sun et al., 2021). However, nectar can be very viscous (35% to 65% concentration) and thus can compromise the structural integrity of the tongue. A study employing various techniques, such as scanning electron microscopy (SEM) or atomic force microscopy (AFM), found that each segmented part of the tongue is composed of specialized materials that meet these structural challenges (Sun et al., 2021). Results of the study found that the tongue comprises two kinds of materials: a resilin-rich material, the intersegmental membrane, and a relatively more rigid hard material, which is a ring-like hair base giving stable support for hairs and for the whole structure (Sun et al., 2021). Nevertheless, while we have seen that the tongue is a complicated structure composed of many specialized materials, it is far from perfect regarding nectar leakage (He et al., 2021).
Mathematical modeling considering leakage
Nectar leakage can occur in between hair segments. While nectar would ideally fill all the space between the hairs on the tongue, in reality, a non-negligible percentage of it escapes the pores while the tongue retracts and contacts with air (He et al., 2021). In order to evaluate this quantity of nectar leaked, a mathematical model was developed.
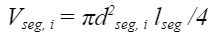
To analyze this leakage, the nectar trapped in one particular tongue segment is considered. In this case, a segment designates one cylindrical part of the tongue that stretches from the base of one ring of hairs to the upper one, as shown in Figure 5. The ith segment has a length of lseg and a diameter of dseg, i (He et al., 2021). Furthermore, the angle at which hairs experience maximal erection is θ¯, and the total volume of the ith segment is Vθ¯, i,, which includes that of the tongue part itself and that of the hairs. The total volume of this segment can thus be calculated with Equation 8.

Equation 8 Total volume of the ith segment of the tongue, the hairs and the ideal nectar volume trapped in (He et al., 2021).
This equation gives us the total volume but not the volume of nectar. Therefore, it would be useful to find the volume of the tongue segment as well as that of the hairs (Eq. 9).
Equation 9 Volume of the ith segment of the tongue (He et al., 2021).
To compute the volume of the hairs, an extra measurement is needed: linear hair density nhair.
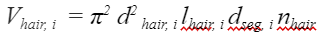
Equation 10 Volume of the hairs contained in the ith segment of the bee's tongue (He et al., 2021).
Given this set of equations, it becomes relatively easy to compute the value of the nectar volume lodged in the ith segment of the tongue. Note that this volume here is the ideal present volume that varies and is greater than the actual volume infiltrated between the hairs.
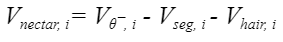
Equation 11 Ideal volume of nectar in the ith segment of the tongue (He et al., 2021).
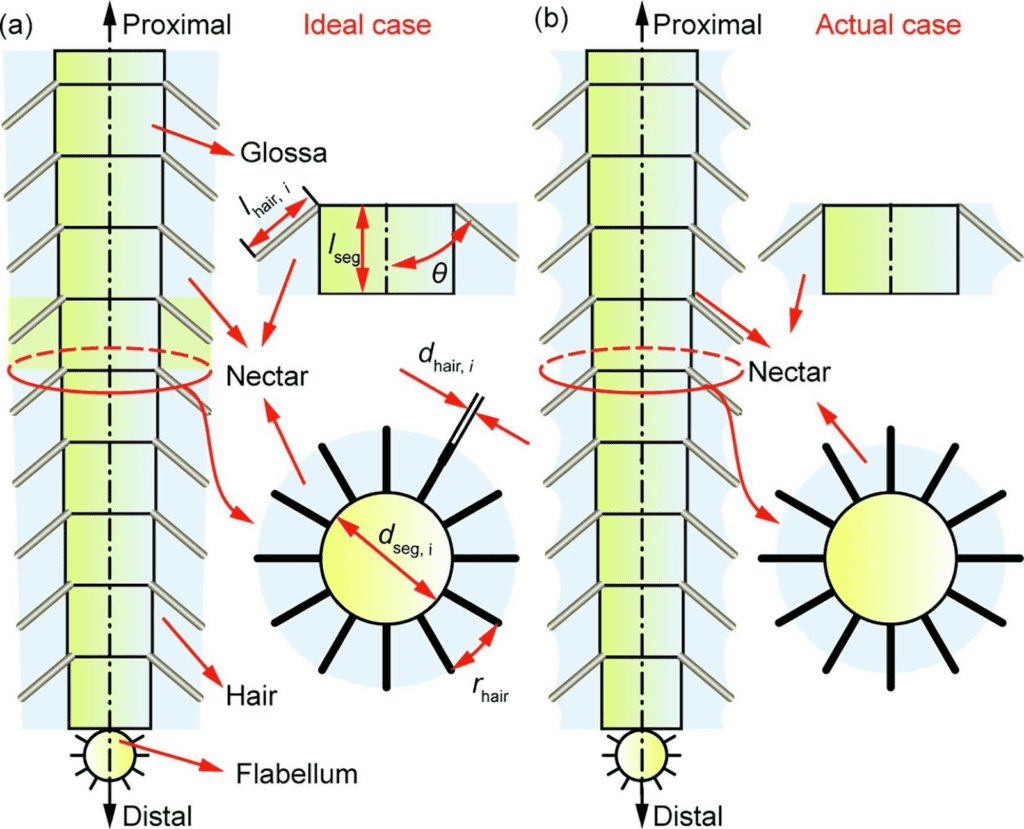
Fig. 5 Representation of a bee's tongue segmented into various parts, each containing one hair ring and the nectar trapped on the tongue in both ideal (a) and normal cases (b) (He et al., 2021).
In order to more accurately model nectar extraction by a bee's tongue, the amount of leaked nectar should be considered, through the introduction of the leakage factor Cleakage. This coefficient is proportional to the density of the nectar, the hair spacing as well as the axial spacing (He et al., 2021). It can be used to calculate the volume of nectar leaked using Equation 12 below.
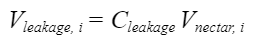
Equation 12 Volume leaked expressed as a function of the total volume of nectar and leakage coefficient (He et al., 2021).
From this formula, researchers were able to deduce the actual volume of nectar ingested in a given section of the tongue, to be modeled with Equation 13.

Equation 13 Volume intake in one tongue compartment (He et al., 2021).
Those equations show that the quantity of nectar a bee is capable of ingesting with every tongue protraction – retraction cycle is tightly related to the length of the hairs and their inclination, but also and most importantly the density of the nectar the bees ingest (He et al., 2021). This is because nectar density is considered when calculating the leaking factor Cleaking . Nectar density, as mentioned previously, can vary extensively from one flower to another, ranging from 35% to 65% (Sun et al., 2021). Therefore, to determine what factors are associated with minimal leakage, a graph was drawn that relates the leakage factor with the nectar density and the length between successive hair rings (Fig. 6) (He et al., 2021). Essentially, the lower the distance between hair rings, the less the leakage of nectar. Inversely, the higher the viscosity, the lower the amount of nectar that falls off the bee's tongue.
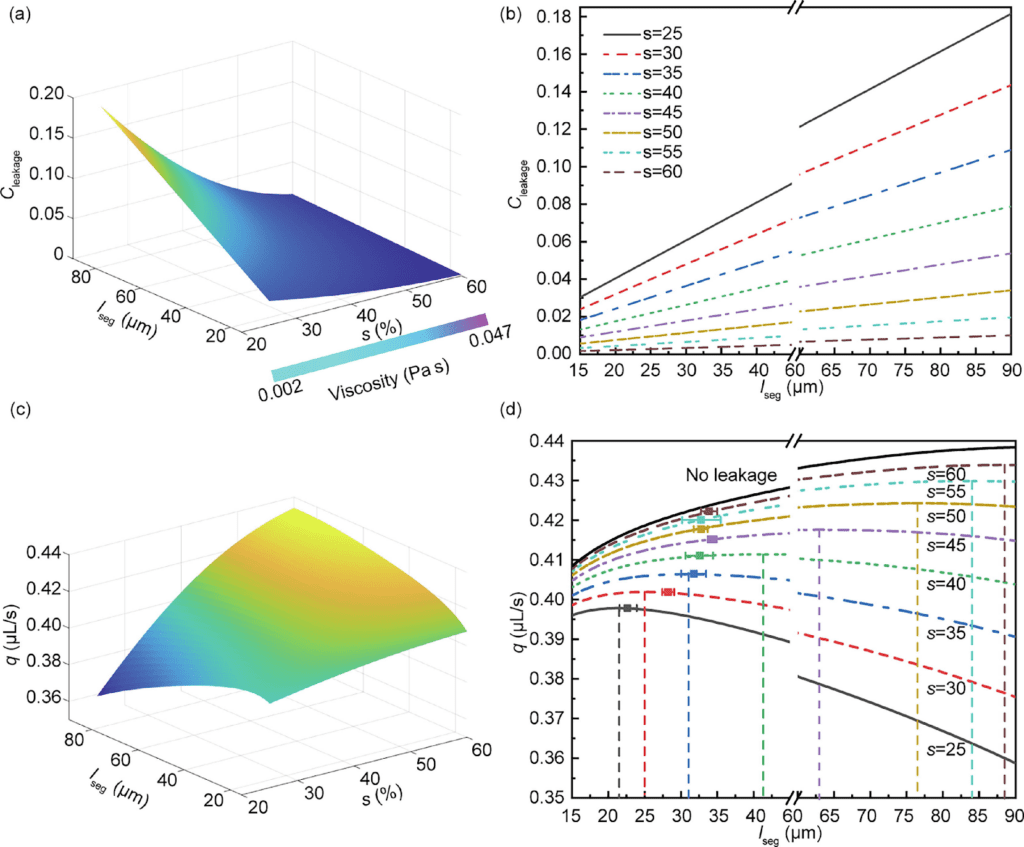
Fig. 6 Graph representing Cleakage in relation to lseg and the viscosity of the nectar (He et al., 2021).
Mathematical modeling of hummingbird tongues during nectar extraction
Nectar is one of the main food sources hummingbirds rely on for survival (Fig. 8). As such, the species has evolved to efficiently extract nectar from the stamens of flowers at high frequency. As a result, the scientific community has extensively studied the mechanisms through which hummingbirds use their specialized tongues to extract nectar. Recently, a debate has emerged between two potential extraction mechanisms: “fluid trap” and capillary siphon. Through biomechanical analysis and the development of mathematical models, studies are beginning to show that these are two complementary mechanisms rather than mutually exclusive ones (Kim et al., 2012).
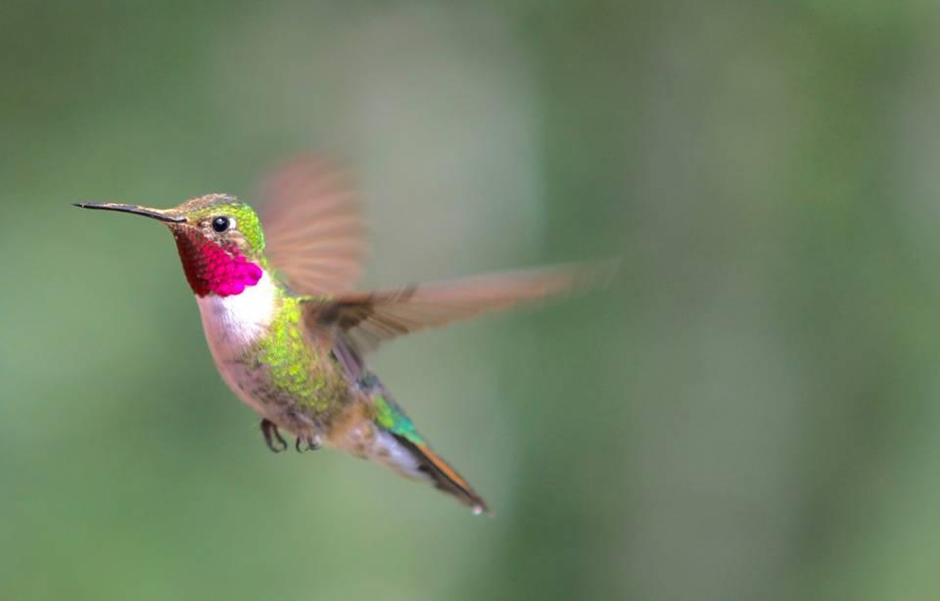
Fig. 7 Photo of a hummingbird (Coppard, 2021).
Tongue deformation as a motivation for a mathematical model
The shape of the hummingbird's tongue plays a significant role in the process of loading and unloading nectar from flowers (as seen in: A Biomechanical Review of Animal Tongue Functions). In a study by Rico-Guevara, rapid shape changes in the hummingbird tongue were observed through high-speed filming and allowed scientists to better understand their geometric structure (Fig. 8) (Rico-Guevara & Rubega, 2011). The tongue forms two forks, each consisting of a supporting rod fringed with lamellae (Rico-Guevara & Rubega, 2011).
Fig. 8 A) Shape changes of a hummingbird tongue captured by a high-speed camera, filming under a scale of 25 ms per image. B) Dorsal view of the hummingbird's tongue showing the shape changes and formation of two separate capillary tubes (supporting rods represented by black dots, and lamellae represented by thin grooves attached to the dots) (Rico-Guevara & Rubega, 2011).
These shape changes are integral to the loading and unloading of nectar into the tongue for consumption. In another study based on images from a high-speed camera, the change in the surface area of a hummingbird's tongue throughout a licking cycle was examined to investigate the idea that surface area is strongly related to the effectiveness of nectar loading (Kim et al., 2012). In a solution of 20% concentration of sucrose, the tongue width becomes smaller when the inner surface is wetted with sucrose (Fig. 9). More specifically, the outer diameter is decreased by approximately 10 percent (Fig. 10). However, the cause of this change was not due to surface tension, leading to the idea that nectar loading is a process caused by capillary siphon (Kim et al., 2012).
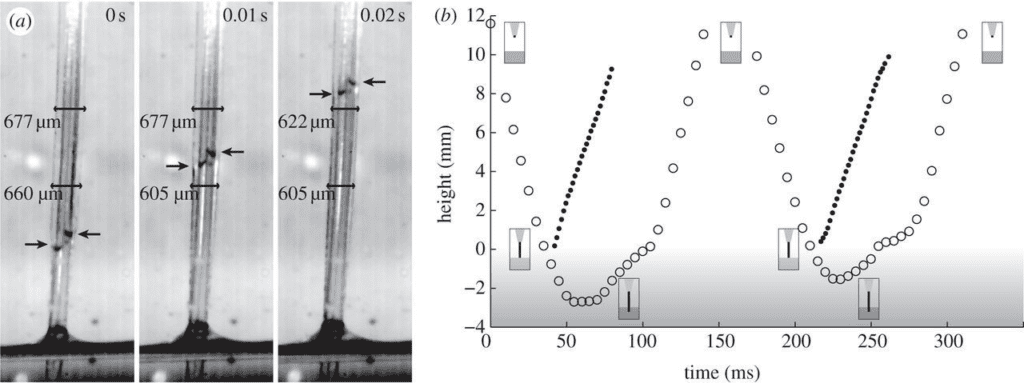
Fig. 9 a) Side view of a hummingbird tongue in 20% concentration sucrose with arrows showing the location of the sucrose inside the tongue. Note that the inner surface narrows once wetted with sucrose. b) Length of the tongue immersed in sucrose (measured every 5 ms) as a function of time, showing the sucrose ascending at each licking cycle (Kim et al., 2012).
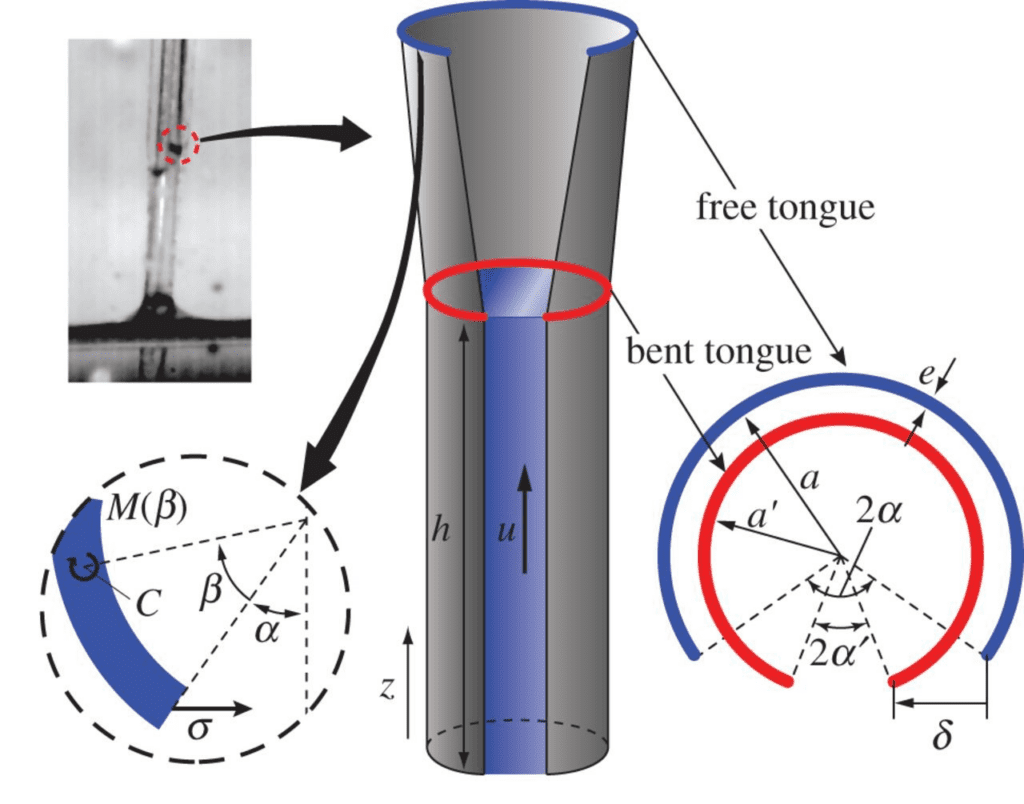
Fig. 10 Dorsal view of the tongue showing a decrease in diameter when the inner surface contacts nectar. Variables for the geometry of the tongue are presented (Kim et al., 2012).
Mathematical model of capillary phase
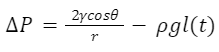
To analyze the capillary siphon phenomena, a mathematical model can be developed showing how each aspect of the siphon functions in loading and unloading nectar. For ease of mathematical analysis of the loading and unloading process, the nectar flow in the vertical and horizontal directions can be separated (Kingsolver & Daniel, 1983). Each groove of the tongue is modeled as a thin-walled cylindrical tube, as illustrated in Figure 10. Within these tubes, the capillary siphon phenomena take place, and a study was conducted to model this process (Kingsolver & Daniel, 1983). The time from t = 0 s and the distance of the nectar from the end of groove l = 0 (surface of fluid) were measured. It is known that there must be a capillary force that makes the fluid in each ascend (in direction of flow) and a viscous force opposing the flow. There must therefore be a force balance between these (Kingsolver & Daniel, 1983). The pressure change due to the capillary force can be described with Equation 14.
Equation 14 Function for the change in pressure that induces fluid flow, where γ represents the surface tension coefficient of the fluid, θ is the surface contact angle between groove and fluid, r is the radius of groove (Kingsolver & Daniel, 1983).
This equation calculates ΔP, the pressure drop that induces fluid flow. In order to model the position of nectar in the groove as a function of time (t) using pressure drop, the Hagen-Poiseuille relation, which calculates the pressure drop in a long cylindrical tube, can be employed (Jagannath Mazumdar et al., 2016, pp. 1–60).
Equation 15 Poiseuille equation to calculate the volumetric flow rate Q(t) at a time t. A is the groove cross-sectional area, l(t) is the distance traveled by the fluid and μ is the fluid viscosity (Kingsolver & Daniel, 1983).
Based on these two equations, the relationship between pressure drop, distance traveled with respect to time, and viscosity (μ) can be understood. Therefore, the equation of the flow rate can be derived, and then the instantaneous energy intake rate at time t (Eq. 16) found.
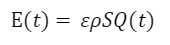
Equation 16 The relation between instantaneous energy intake and volumetric flow, where ε represents the energy content of sucrose (substance dependent), ρ is the fluid density, and S is the nectar concentration (Kingsolver & Daniel, 1983).
Further, by substituting equations for Q(t) and ΔP into Equation 16, the instantaneous energy intake function can be written as follows (Eq. 17). This equation illustrates that the energy intake rates are dependent on the physical properties of nectar (i.e.. surface tension coefficient, viscosity, concentration etc.).
Equation 17 Instantaneous energy intake with respect to t (Kingsolver & Daniel, 1983).
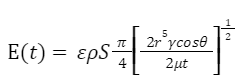
In the vertical feeding direction, a similar model can be used to develop a function for the energy intake rate. In this case, the equation for pressure drop 𝑃 is outlined in Equation 18 below.
Equation 18 Pressure drop in the vertical feeding direction (Kingsolver & Daniel, 1983).
Note that there is an additional term 𝜌𝑔𝑙(𝑡) in this equation. This is because the energy balance due to gravity must be considered. For simplicity of our calculation, we let α=2𝛾𝑐𝑜𝑠𝜃/r and 𝑏≃𝜌𝑔. Now we go through a similar derivation process as followed above for the horizontal feeding direction to obtain the equation of instantaneous energy intake rate (Eq. 19).
Equation 19 Instantaneous energy intake with respect to t (Kingsolver & Daniel, 1983).
This function is characterized by a complex term in the denominator. This is due to the inability to explicitly express l(t) in the vertical direction (Kingsolver & Daniel, 1983). However, the same conclusion as in horizontal feeding can be deduced from this function: the physical properties of nectar affect the energy intake rate.
Factors that affect nectar selection and energy intake efficiency
The mathematical model for energy intake efficiency with respect to physical properties of nectar outlined above allows researchers to predict which type of nectar is the best choice for feeding hummingbirds. Based on the equations derived, the energy intake efficiency is related to concentration, surface tension coefficient, energy content, nectar density, and viscosity (Kingsolver & Daniel, 1983). The change in energy content can be safely ignored in this model since only nectar is being used. Each of these properties can be related to the concentration of nectar. If the concentration of nectar changes, the other dependent properties also change accordingly; therefore, the best concentration of nectar for energy intake efficiency is useful to find other parameters. To obtain the efficiency of licking nectar, a model for the licking cycle must first be developed (Kingsolver & Daniel, 1983). By setting tc as the duration of capillary loading phase and tm as the duration of unloading phase, the time for one complete licking cycle tf can be described with Equation 20 below.

Equation 20 Time per lick (Kingsolver & Daniel, 1983).
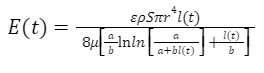
Using the functions for E(t) derived above, we can now calculate the energy intake in each cycle. To facilitate the maximization of E, the duration of capillary phase can be fixed as tc = T. Further, tc can be written in terms of l(t) (Eq. 15), to obtain Equation 21 for the energy intake of a complete licking cycle below.
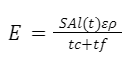
Equation 21 Energy intake in one licking cycle (Kingsolver & Daniel, 1983).
This function shows that the energy intake for a licking cycle is maximized when the duration of capillary and unloading phases are equal, and is dependent on nectar concentration (Kingsolver & Daniel, 1983). In a study investigating the optimal concentration of nectar for hummingbird tongues based on high-speed imaging, the energy intake rate was shown to be maximized when the concentration of nectar was approximately 35-40% (Fig. 11) (Kingsolver & Daniel, 1983).
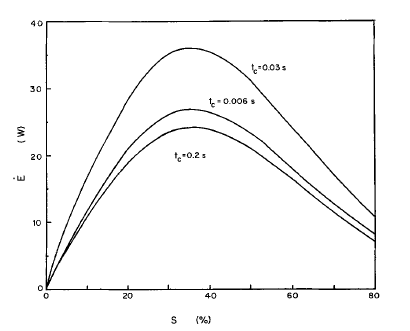
Fig. 11 Energy intake rates (E) as a function of nectar concentration. The relationship is plotted for 3 different durations of capillary phase (tc) (Kingsolver & Daniel, 1983).
Conclusion
Tongues of different species have evolved to perform impressive and unique functions which facilitate their survival in the animal kingdom. These tongue functions can be further understood by developing complex mathematical models based on observations and experimental data. Chameleons possess the impressive mechanical ability to project their tongues with large accelerations due to energy stored within the different structural components of their tongues. A model for the energy stored in the tongue to power projection was developed, depending on the energy density stored within the intralingual sheaths and the accelerator muscle independently. Bees have evolved to possess unique tongue structures characterized by a lining of hairy structures and specialized materials designed by nature to withstand the necessary pressures of nectar extraction. While this process is efficient, nectar leaking does occur and can be modeled mathematically. Similarly, hummingbirds rely on the ability to extract nectar from flowers using their specialized tongues. This extraction process, described as a capillary siphon, can be modeled through functions of pressure differences and energy intake rates. The energy intake rates outlined by this model can be optimized to determine the optimal nectar concentration for efficient extraction by these birds.
Overall, through the employment of mathematical tools, much can be understood about the natural world and the behavior of species within it. Further, mathematical modeling of animal behavior has the potential to solve problems in engineering design. For example, the Chameleon Swarm Algorithm developed based on models of chameleon foraging behavior, can be applied to solve complex optimization problems in a variety of applications. The ingenious designs developed by nature to solve conundrums facing species can serve as valuable inspirations for engineers.
References
Abualigah, L., Elaziz, M. A., Khasawneh, A. M., Alshinwan, M., Ibrahim, R. A., Al-qaness, M. A. A., Mirjalili, S., Sumari, P., & Gandomi, A. H. (2022). Meta-heuristic optimization algorithms for solving real-world mechanical engineering design problems: a comprehensive survey, applications, comparative analysis, and results. Neural Computing and Applications, 34(6), 4081–4110. https://doi.org/10.1007/s00521-021-06747-4
Anderson, C. V. (2016). Off like a shot: scaling of ballistic tongue projection reveals extremely high performance in small chameleons. Scientific Reports, 6(1). https://doi.org/10.1038/srep18625
Braik, M. S. (2021). Chameleon Swarm Algorithm: A bio-inspired optimizer for solving engineering design problems. Expert Systems with Applications, 174, 114685. https://doi.org/10.1016/j.eswa.2021.114685
Coppard, S. (2021, July 15). Hummingbird guide: species facts and where to see. Discoverwildlife.com; Discover Wildlife. https://www.discoverwildlife.com/animal-facts/birds/facts-about-hummingbirds/
de Groot, J. H., & van Leeuwen, J. L. (2004). Evidence for an elastic projection mechanism in the chameleon tongue. Proceedings of the Royal Society of London. Series B: Biological Sciences, 271(1540), 761–770. https://doi.org/10.1098/rspb.2003.2637
He, Z., Zhang, W., Sun, Y., Li, C., Wu, J., & Wu, Z. (2021). How honey bees dip nectar: Dynamic spacing of tongue hairs facilitates to collect nectar of various viscosities. Journal of Theoretical Biology, 512, 110538. https://doi.org/10.1016/j.jtbi.2020.110538
Jagannath Mazumdar, S Sircar, A Saha, & K Wong. (2016). Biofluid mechanics (pp. 1–60). New Jersey World Scientific.
Kim, W., Peaudecerf, F., Baldwin, M. W., & Bush, J. W. M. (2012). The hummingbird's tongue: a self-assembling capillary syphon. Proceedings of the Royal Society B: Biological Sciences, 279(1749), 4990–4996. https://doi.org/10.1098/rspb.2012.1837
Kingsolver, J. G., & Daniel, T. L. (1983). Mechanical determinants of nectar feeding strategy in hummingbirds: energetics, tongue morphology, and licking behavior. Oecologia, 60(2), 214–226. https://doi.org/10.1007/bf00379523
Moulton, D. E., Lessinnes, T., O'Keeffe, S., Dorfmann, L., & Goriely, A. (2016). The elastic secrets of the chameleon tongue. Proceedings of the Royal Society A: Mathematical, Physical and Engineering Sciences, 472(2188), 20160030. https://doi.org/10.1098/rspa.2016.0030
Rafferty, J. P. (n.d.). How Do Chameleons Change Colour? | Britannica. Www.britannica.com. https://www.britannica.com/story/how-do-chameleons-change-colour
Rico-Guevara, A., & Rubega, M. A. (2011). The hummingbird tongue is a fluid trap, not a capillary tube. Proceedings of the National Academy of Sciences, 108(23), 9356–9360. https://doi.org/10.1073/pnas.1016944108
Shi, L., Wu, J., Krenn, H. W., Yang, Y., & Yan, S. (2020). Temporal model of fluid-feeding mechanisms in a long proboscid orchid bee compared to the short proboscid honey bee. Journal of Theoretical Biology, 484, 110017. https://doi.org/10.1016/j.jtbi.2019.110017
Sun, Y., Zhang, J., Tang, X., Wu, Z., Gorb, S. N., & Wu, J. (2021). Specialized morphology and material properties make a honey bee tongue both extendible and structurally stable. Acta Biomaterialia, 136, 412–419. https://doi.org/10.1016/j.actbio.2021.09.045
Tamm, S., & Gass, C. L. (1986). Energy intake rates and nectar concentration preferences by hummingbirds. Oecologia, 70(1), 20–23. https://doi.org/10.1007/bf00377107
Wang, B., Liu, X., Tang, G., Wu, J., & Yang, Y. (2022). Optimal kinematics of the bee tongue for viscous fluid transport. Soft Matter, 18(38), 7317–7323. https://doi.org/10.1039/D2SM00832G