Mathematical Marine Models of Coral Polyps
Michael Beyrouthy, Cris Izzi, Claudio Petroni, Alex Tsiskakis
Abstract
While coral polyps have been extensively studied across various scientific perspectives, this paper will explore them from a Mathematical perspective. Coral's spontaneous growth pattern was mathematically modelled and explained from a polyp-oriented perspective, showing how polyps contribute to growth patterns. Moreover, corals are heavily reliant on their environment which contributes deeply to their growth. The extent to which the environment contributes to the survival and growth of corals is modelled. We investigated coral fractal behavior using morphological analysis and modeling, revealing its key role in increasing surface area for nutrient absorption and photosynthesis. The exploration of Euclidean to non-Euclidean geometry reveals practical applications of mathematics in nature, particularly in understanding the complex, hyperbolic structures of coral species in marine ecosystems.
Introduction
Coral polyps are small marine invertebrates that belong to the phylum Cnidaria. In the previous two papers, the physical and chemical characteristics of these organisms were studied and explored. As a result, an exploration unfolded, unveiling the intricate world of polyps and the mesmerizing corals they create. Coral reefs play an essential role in supporting marine life. With the changing conditions in the oceans, the environment on which they heavily rely is varying, affecting their growth and survival. The level to which the coral polyp can grow and adapt depends on the extent of these changes. Parameters such as surface sea temperature, solar radiation, and production of fluorescent proteins are all considered to assess that. Coral reefs are architectural marvels of the marine world, sculpted by the delicate, yet persistent process of coral growth. In the realm of mathematical biology, coral growth can be simulated and modeled. This entails the application of sophisticated mathematical and computational tools to understand the complex dynamics of coral development. In addition, coral structure has deviated from simple Euclidean geometry to form fractal patterns and hyperbolic forms. The coral structure reveals fractal patterns that are both fascinating and intricate, exhibiting self-similarity at various scales. Furthermore, certain coral species exhibit a non-Euclidean, hyperbolic geometry, characterized by a negative curvature. They both offer insight into how corals efficiently adapt to their environment. In addition, coral polyps typically exhibit radial symmetry, with their body parts arranged in a circular or star-like pattern around a central axis. These unique features can be observed in the intricate designs of specific coral species and contribute to their structural complexity. This paper will go further into detail discussing the key aspects relating to coral growth, fractal geometry, symmetry, and hyperbolic geometry.
Coral growth modelled from a polyp perspective
Overview
As stated in the chemistry paper, the formation of colonial stony corals is shaped by the collective actions of numerous coral polyps, each contributing to the deposition of a coral skeleton atop the existing structure they inhabit. To understand the formation and subsequent growth of corals, mathematical simulations can be used. Existing coral growth models often treat polyps as one unified, continuous surface, such as the hydrodynamically influenced radiate accretive growth (HIRAG) model (Merks et al., 2003). However, an individualized approach can be taken, modeling each polyp's growth and effects separately. Within this approach, coral growth is viewed as the cumulative outcome of a growth process occurring within the individual polyps. This individualized model treats polyps as distinct entities, with each modeled polyp engaging in resource absorption, skeleton deposition, the generation of new model polyps, and eventual demise. This model is called the Polyp Oriented Radiate Accretive Growth (PORAG) model and focuses on individual coral polyps and how their actions contribute to the overall shape of the coral (Merks et al., 2004).
PORAG model breakdown
PORAG is a very complex model which will be explained in simpler terms. In Figure 1, there is an outline of how this model works. We start with a half-sphere shape on the ground level of the model box, covered with 81 simulated coral polyps (Fig. 1a). These polyps are represented by points on a triangular mesh. To figure out how resources spread, we convert the mesh into a 3D cubic lattice (a structured arrangement of points in space forming a grid) (Fig. 1b). The lattice, now resembling a solid obstacle (black cells) surrounded by a fluid (white cells), helps us simulate how growth resources move around (Fig. 1c) (Kaandorp & Sloot, 2001). To do this, we apply the moment propagation (MP) method (a mathematical technique used to simulate the movement of quantities predicting how these quantities spread and change over time in a given environment) along with the lattice Boltzmann method (a numerical technique used for studying how liquids or gases move and interact by breaking down the simulation into small, manageable steps on a grid), setting the stage for potential future inclusion of fluid flow in our simulation system (Merks et al., 2004).
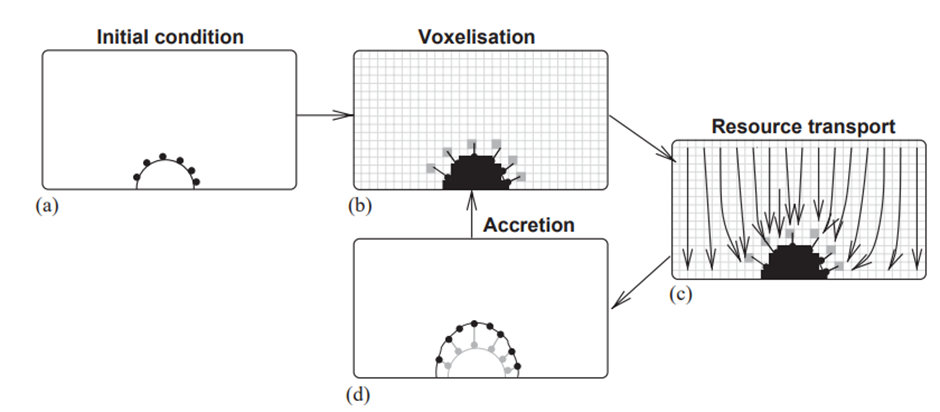
Fig. 1 Schematic flowchart where it starts with a half-circle shape covered in 81 dots, representing coral polyps (a). This shape is converted (voxelized) into a cube lattice (a bit like building blocks) (b) to calculate how resources move around (c). In the dispersion step, the polyps absorb resources from certain parts of the cube pattern. Then, in the accretion step (d), a new layer is added on top of the original shape forming a triangular pattern. The speed at which this new layer grows depends on how fast the polyps are taking in resources. This new layer is then turned (voxelized) into a cubic lattice again, and the whole process starts over (Merks et al., 2004).
The model is also set up with specific points called source (marked as *) and sink (grey) nodes in the model box (Fig 2). At source nodes, the resource concentration (denoted as R) was kept constant at R = 1.0, while at sink nodes, it was maintained at R = 0.0. Solid nodes had a bounce-back boundary condition applied to them, according to the moment propagation method. Unlike the HIRAG model where the entire coral surface absorbed growth resources, in the PORAG model, each coral polyp absorbed its own growth resources from a specific sink cell in the cubic lattice. These sinks were assigned to individual polyps and placed a short distance away from each polyp on the mesh. Different boundary conditions were used for the top, ground, and side planes to simulate various coral growth situations. In one scenario, the sea floor had competing sessile organisms, creating a vertical concentration gradient of the growth resource (Fig 2A). In another scenario, the coral grew in a reef, similar to the first situation but without competing organisms on the sea floor (Fig 2B). In a third scenario, the coral grew in isolation, and resources were supplied from all directions (Fig 2C) (Merks et al., 2004).
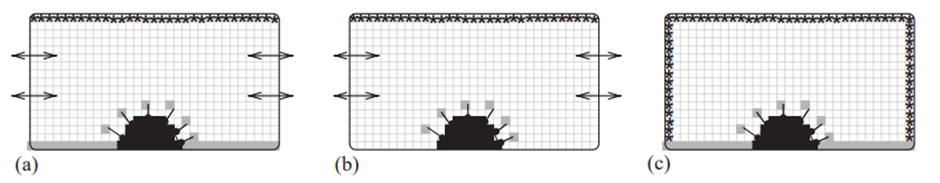
Fig. 2 Different scenarios or conditions for the growth environment (shown in a simplified diagram): (a) source at the top, a sink at the bottom, and the sides act like mirrors. (b) source at the top, the bottom reflects resources, and the sides act like mirrors. (c) sources at the top and sides, and a sink at the bottom. Symbols: * represents a source, grey cell represents a sink, and double arrows indicate periodic boundaries (Merks et al., 2004).
Using this polyp-oriented mathematical approach to modelling coral growth, it was found that morphologies branched spontaneously and randomly (Fig 3). The simulated coral structures developed branching patterns without explicit instructions or predefined rules for branching. Instead, the branching occurred as a result of the interactions and behaviors of individual coral polyps where the collective behavior of the individual polyps shapes the whole coral colony (Merks et al., 2004).
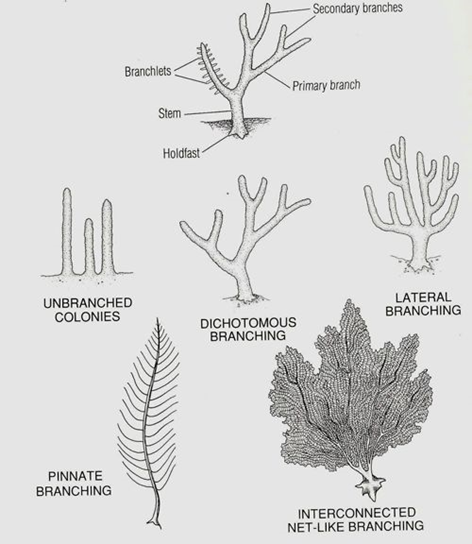
Fig. 3 Different Coral Branching Morphologies (Nature Foundation, 2023).
Polyp competition effect
From this mathematical model, there is a potential hypothesis explaining this “spontaneous” branching. At convex sites, the polyps spread and fan out, thus improving their exposure to resources. Conversely, at concave sites, the polyps orient towards each other, hindering the absorption of resources. This curvature effect emerges as a result of the competition among polyps for resource uptake from the water. As the average distance between polyps increased, the random branching tendency of the model corals decreased leading to more consistent growth patterns. This aligns with the polyp competition idea, indicating that competition for resources weakens as the mean distance between polyps grows larger. The hypothesis suggests that the spatial arrangement and competition for resources among polyps can lead to the characteristic branching patterns observed in coral colonies (Merks et al., 2004).
This curvature effect can also be proved using the geometric analysis of the fraction of the coral surface area that belongs to an absorbing polyp mouth and relating this to the local curvature. This is achieved by linking the growth of coral polyps to the curvature of the coral surface they reside on.
Figure 4a depicts a two-dimensional diagram illustrating how the “polyp fanning effect” can influence coral growth. This diagram shows a cross-section of a coral surface with protruding polyps. d2 represents the distance between polyp mouths, d1 represents the “inter-polyp” distance, r is the radius of curvature, lreach is the reach distance of the polyp from the coral to absorb resources, and k is the curvature of the coral surface (Merks et al., 2004).
Equation (1) describes the “absorbance ratio” which is the ratio of the non-absorbing area and the total area of the coral surface as a function of the “inter-polyp” distance d1 and the curvature. This absorbance ratio reflects how much of the coral surface area is available to a polyp for absorbing resources. The equation is derived assuming that resource absorbance occurs within a single spherical voxel (a volume element in three-dimensional space) centered on the polyp mouth (Merks et al., 2004).
a(k,d_1 )=1/(d_1 (1+k ×l_{reach} ) )(1)
Equation (2) represents the partial derivative of the absorbance ratio with respect to the curvature k, which helps elucidate how changes in the curvature affect the resource absorption capacity of the polyps. We observe that a slight alteration in curvature resulting from a growth step has a more pronounced impact on the fraction of the absorbing surface when the polyps are closely arranged (Fig. 4b) (Merks et al., 2004).
(∂a(k,d_1))/∂k=l_{reach}/(d_1 (1+k ×l_{reach} )^2 )(2)
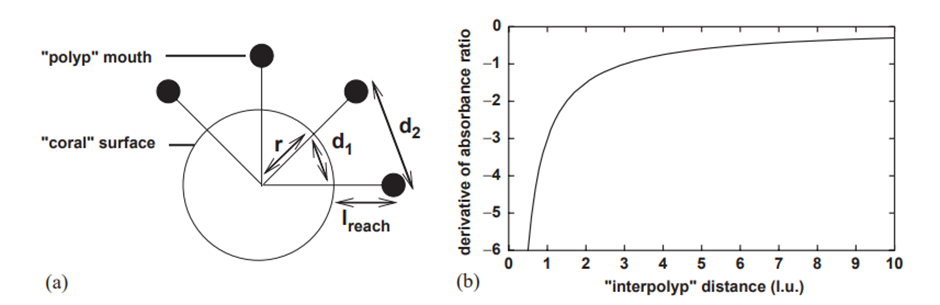
Fig. 4 Geometric examination of the polyp fanning effect: (a) A two-dimensional illustration depicting the coral surface with key parameters such as r (radius of curvature), d1 (‘inter-polyp' distance), and d2 (distance between ‘polyp' mouths). (b) Examining the derivative at k = 0 of the ratios between the non-absorbing area and the total area of the coral surface in relation to the ‘inter-polyp' distance (d1), where lreach = 3 the reach distance of polyp (Merks et al., 2004).
This geometric analysis implies that at regions of high curvature, polyps are more spaced out due to the surface geometry, which allows for more effective resource absorption and potentially leads to the initiation of more consistent growth patterns.
Conversely, in areas where the coral surface has less curvature, the polyps may be more closely packed, leading to increased competition and potentially leading to random branching or no branching altogether (Merks et al., 2004).
The geometrical analysis thus provides a quantitative framework to understand how polyp competition for resources can lead to the branching structures seen in coral colonies. It suggests that the fanning of polyps in areas of high curvature is a more robust and realistic mechanism for coral branching than previous models that required explicit rules for growth coordination across the entire colony.
From this individualized, polyp-based model, we can observe spontaneous branching, which can be attributed to a phenomenon termed the “polyp fanning effect,” which can be visualized in Figure 5, wherein polyps on convex surfaces gain a competitive edge over those on flat or concave surfaces (Merks et al., 2004).
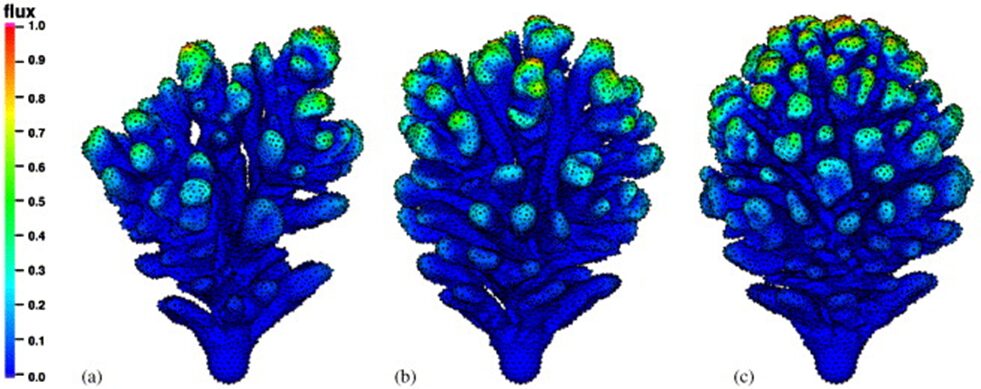
Fig. 5 Here the Polyp fanning effect can be visualized in a simple way. (a) represents coral branching on a curved surface. Here we can see that the polyps are able to undergo increased fanning which spaces the polyps out and as a result, the inter-polyp distance is increased. (b) represents coral branching on a less curved surface and here we can see the polyps are less susceptible to fan and thus the inter-polyp distance is diminished. (c) represents coral branching on a flat surface and here we can see that polyps are closely packed due to the reduced fanning capabilities on flat surfaces (Merks et al., 2004).
Coral colonies can contain thousands of polyps and reefs can contain millions of corals (Florida Fish and Wildlife Conservation Commission, 2022). In order to achieve such colony sizes, coral polyps must find ways to maximize consistent growth in such low-nutrient environments and polyps achieve this consistency through this “polyp fanning effect.” This curvature effect affects polyps by enhancing the consistent branching of their coral skeleton and is an evolutionary process undergone by coral polyps to maximize constant and consistent colonial growth in low-nutrient environments.
Modelling the environmental effects on the coral reefs
Overview
Climate change has deeply affected the ecosystems of the world, and underwater marine life is no exception. Coral polyps survive on intricate interactions with their surroundings, especially their symbiotic relationship with the zooxanthellae, which is critically affected by the temperature and irradiance levels. Climate change has resulted in global warming, which showed a 4.5-times higher mean increase in ocean surface levels since 120 years (Garcia-Soto et al., 2021). Changes to the atmosphere in which polyps live have drastic effects on the polyps themselves. Thus, scientists have tried to model the interactions of the corals with their environment as well as their ability to adapt to these changes.
Modelling the interactions with their environment
The polyps' interactions with the environment can be exemplified by their response to these changing conditions. To combat the rise in temperature and solar irradiation levels, the polyp utilizes its fluorescent proteins (FP). These proteins scatter light, preventing absorption by the polyp, and shielding it from both increases in temperature and high irradiance (Lyndby et al., n.d.). In addition, the polyps utilize melanin (M) for its photoprotective properties. Thus, by analyzing these two responses to the change in sea surface temperature (SST) and solar radiation (SR), the interaction of the corals can be modelled (Nieves-González et al., 2019).
González and coworkers built a model studying the A. cervicornis corals based on a set of assumptions. First, the corals had a finite amount of resources, including energy that is allocated between the functions of the coral such as growth or protective mechanisms. Furthermore, the stress caused by the difference in sea surface temperature and solar radiation are equal and vary in the same way according to the depth. Additionally, the energy for the synthesis of FPs and melanin is the same. Furthermore, they used the function F(ḋ) to model the environmental variables where ḋ is the ratio of the depth to the maximum depth where the A. cervicornis grows, which is approximately 30 m. Then ḋ = d/dm. Based on the limiting resource theory, F1(ḋ) affects the number of polyps. As depth increases, the number of polyps decreases. Likewise, F2(ḋ) and F3(ḋ) affect the syntheses of FP and M respectively. As depth increases, the syntheses of FP and M concentration increase. F1(ḋ), F2(ḋ), and F3(ḋ) must be positive, decreasing, and continuous functions of ḋ (Nieves-González et al., 2019).
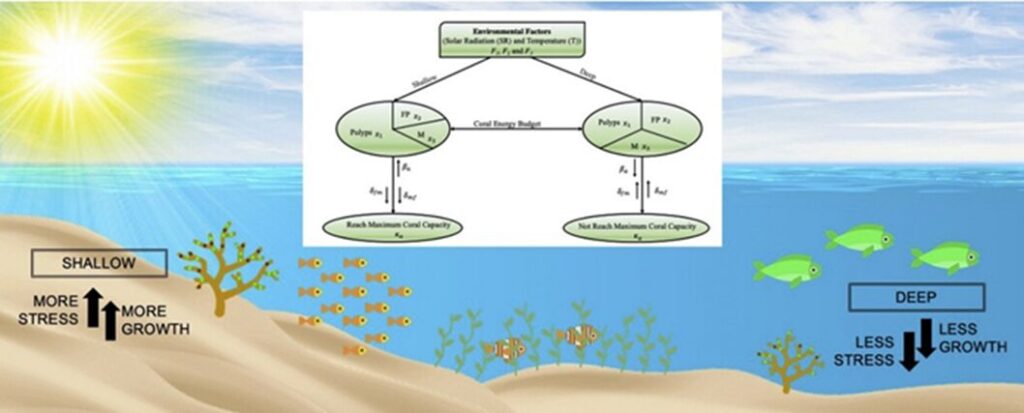
Fig. 6 Schematic diagram of the mathematical model. Fi, i = 1, …, 3 are the environmental functions. x1, x2, and x3 are the number of coral polyps, melanin (M) concentration, and fluorescent protein (FP) concentration, respectively.
Based on these assumptions they created the model:
x_1 (t) = F_1 (ḋ) x_1 (1-x_1/κ_a )-δ_a x_1-(δ_af x_2+δ_{am} x_3 ) x_1(3)
x_2 (t)=F_2 (ḋ) x_2 x1-(δ_f x_2 x_1+δ_{fm} x_3 x_2 )(4)
x_3 (t)=F_3 (ḋ) x_3 x_1-(δ_m x_3 x_1+δ_{mf} x_2 x_3 )(5)
where x1 represents the growth of A. cervicornis coral (in units of polyps per cm3), and x2 and x3 represent FP and M concentrations in mmol/cm3. The parameters are: δa, κa, δf, δm, δaf, δam, δfm, and δmf. δa and κa are the natural death rate and maximal growth capacity of the A. cervicornis branches, respectively; δf and δm are the breakdown rates of FP and M, respectively; δaf and δam are the death rates of a branch due to the presence of FP and M, respectively; δfm is the breakdown rate of FP due to the presence of M; δmf represents the breakdown rate of M owing to the presence of FP. F1(ḋ), F2(ḋ), and F3(ḋ) represent the environmental functions. They incarnate the relation between, SST, SR, and the growth rate of A. cervicornis or synthesis of FP and M. Observe in equation (2) that F1(ḋ) acts as a birth rate of polyps (βa). Similarly, in equations (3) and (4), F2(ḋ) and F3(ḋ) as modifiers of the synthesis rate of FP and M, respectively. Moreover, for the stability and bifurcation analysis, the exact form of the functions is unimportant as long as they satisfy the model assumptions. The values for the ci in Equation (2) were determined by fitting the functions to polyps' birth rate data (Nieves-González et al., 2019).
Adaptation to the environment:
Cropp (2020) modelled the adaptation response of coral reefs to the changes in the climate through an eco-evolutionary model. In his model, he takes into consideration the potential of coral reefs to adapt to climate change by modelling basic processes. It considers the adaptation of both coral and symbiont adaptations to the increasing temperatures.
This eco-evolutionary model takes into consideration Zooplankton, corals, phytoplankton symbionts, and nutrients to all be part of the food chain essential for the survival of corals. All these populations play a vital role in the survival of coral reefs as the zooplankton feeds on the phytoplankton, the coral feeds on the zooplankton, and the symbiont resides within the polyp and provides energy from their photosynthesis (Cropp & Norbury, 2020).
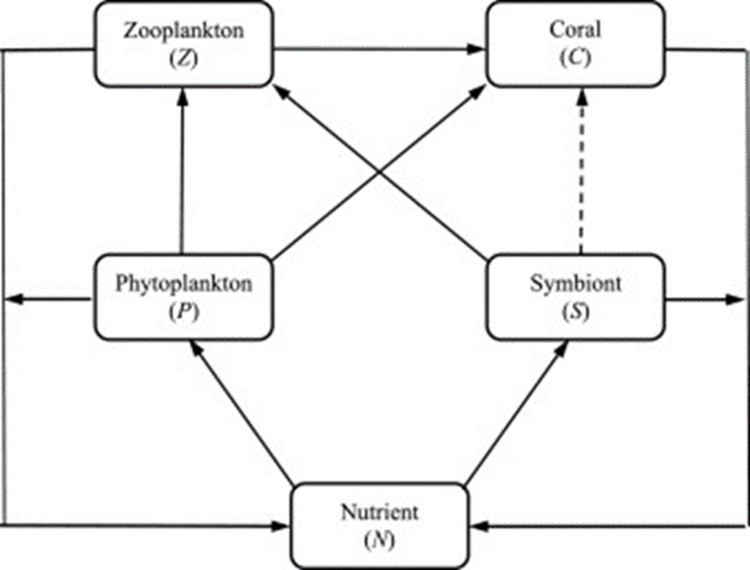
Fig. 7 Schematic of the food web connections described by the model in equations (5). The boxes show the abiotic (N) and biotic (P, S, Z, C) populations and the arrows show the flows of nutrient mass due to predation, respiration, and mortality. The dashed arrow represents the provision of photosynthetic byproducts from the symbiont to the coral (Cropp & Norbury, 2020).
This eco-evolutionary model consists of 9 differential equations, five to describe the ecological dynamics and four to describe evolutionary dynamics:

(6)
Tc represents the temperature at which half the coral population ejects its symbionts, and Tsrepresents the temperature at which the average symbiont achieves optimal growth. Tccand Tss refer to coral and symbiont mortality respectively. Here, t represents time, T represents the ambient water temperature, The parameters aij, i,j = two of P, S, Z, and C represent the intensity of the interactions between the populations through competition, predation, and symbiosis; the ri, i = P, S, Z, or C, and gS, mS, and mC represent how the populations interact with the inorganic nutrient pool through growth or mortality; and α, γS, κ, and γC describe the shape of the S or C population's response to changes in water temperature. α is a parameter that determines the shape of the temperature response, which does not evolve on the relevant time scales (Cropp & Norbury, 2020).
These equations were able to predict the adaptation of corals to the changing environment. This model suggests that the corals can adapt to recover to their original stable state only if it has the ability to adapt to the maximum temperature experienced in their environment. Moreover, the instability of the system is most evident in the interaction between the symbiont and the corals, showing the drastic effect of temperature increase on these two organisms, compared to the lower impact on the stability of the zooplankton and the phytoplankton. Simulations run with fast adaptation showed that coral populations may recover too rapidly.
Fractal geometry
Overview
Coral reefs face environmental challenges such as nutrient scarcity and physical stress while living at the bottom of the ocean. To adapt, they have developed an ingenious design solution: fractal geometry. Fractal geometry, commonly associated with math and art, also plays a significant role in nature, notably in coral reefs. This adaptation features self-similar patterns that repeat across different scales meaning they are visible in both small parts and the entirety of a coral reef (Figure 8). Living in these depths, where resources can be limited, the fractal structure increases the surface area of coral reefs, making photosynthesis, nutrient absorption, and gas exchange more efficient. These adaptations are vital for their survival in the demanding marine environment and showcase the intelligent ways nature evolves to overcome challenges (Purkis et al., 2006).
This remarkable adaptation is evidenced through measurements of the seabed around coral reefs. Analysis of these measurements using the power law demonstrates the presence of fractal patterns in the reefs.
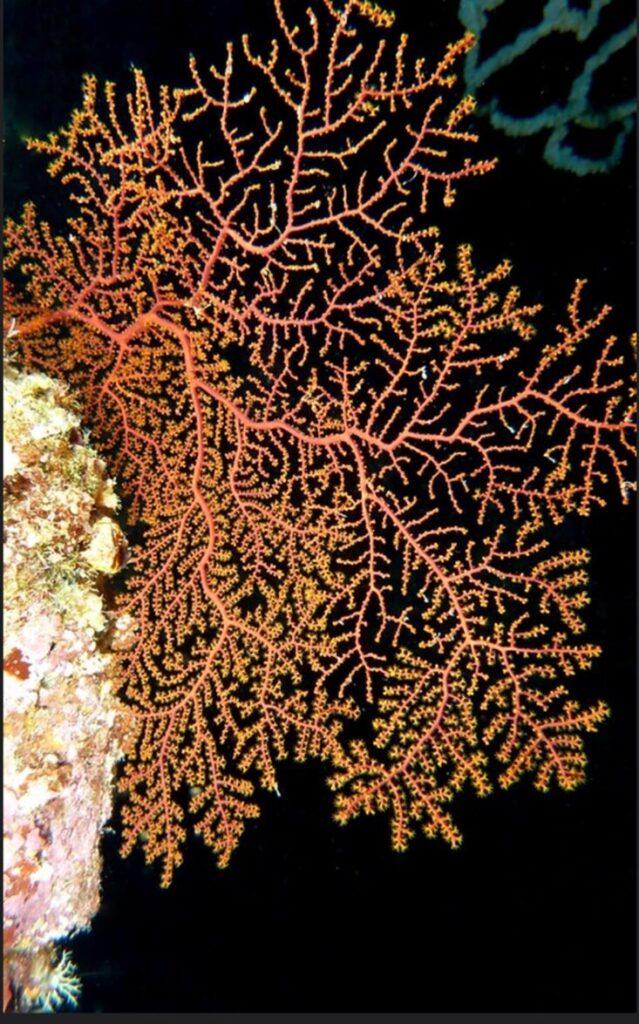
Fig. 8 Red gorgonian sea fan coral (Alcyonacea) displaying fractal branching patterns with extended orange polyps. The coral's structure demonstrates the efficient fractal geometry commonly observed in marine organisms, optimizing surface area for feeding (Hamlet et al., 2023).
Relationship between power law and fractal geometry
In the realm of mathematics and science, the power law is a fundamental concept that describes the relationship between two quantities, where one quantity varies as a power of another. This relationship is commonly represented by the following equation.
Y=αX^β
(7)
In this equation, X is the quantity being compared, α is a constant, and β is the exponent that shows how Y changes in relation to X. Applied to coral reefs, this concept helps scientists understand the relationship between the size of different parts of the reef (spatial scale denoted by X) and how often certain features or patterns occur at these sizes (spectral density of the seabed elevation represented by Y). By fitting data to this power law equation, researchers can see if the reef's patterns repeat consistently across different sizes. The values of α and β obtained from this analysis are crucial. Particularly, the value of β is revealing. If β is not a whole number (like 1, 2, or 3), it suggests that the reef has a fractal pattern. Fractals are structures that do not fit into traditional, whole-number dimensions. Unlike simple shapes such as lines (1D) or squares (2D), fractals display complex patterns that repeat at different sizes or scales. This repeating, intricate pattern, which does not change regardless of the scale at which you observe it, is known as self-similarity, a defining feature of fractal geometry. The non-integer value of β mathematically confirms that coral reefs have this kind of complex, scale-repeating structure (Brown et al., 2002).
Application of power law in coral reef fractals
In a study of the coral reefs of French Polynesia, scientists applied the power law to investigate the fractal nature of these marine ecosystems. Using high-resolution bathymetric surveys, they collected data on seabed elevations across scales ranging from 0.1 to 7 meters.
By applying the power law equation, researchers identified a non-integer value of β=0.92, alongside α=0.0072. This non-integer value of β was crucial, as it indicated the presence of fractal geometry within the coral reefs. The analysis showed a consistent fractal-like pattern within the specified scale range, confirming the fractal nature of the coral reefs (Sous et al., 2020).
Advantages of fractal behavior
The fractal nature of coral reefs yields significant biological advantages. Notably, many benefits are brought about by the increased surface area resulting from fractal geometry.
In coral reefs, this is manifested in the way coral branches subdivide into smaller branches, which in turn subdivide further. This repetitive branching is not just a simple bifurcation but involves intricate, often non-linear, patterns that repeat at increasingly smaller scales. Every time a branch subdivides, new surfaces are created. Unlike in simple geometric division where the increase in surface area might be linear (like cutting a square into four smaller squares), in fractal structures, each subdivision adds disproportionately more surface area. This is because the new branches themselves have complex, non-linear shapes that increase the surface area more than a simple extension would. While branching significantly increases surface area, it does not add as much volume because the new branches are relatively thin compared to the whole structure. Therefore, fractal branching results in a high surface area-to-volume ratio (Brown et al., 2002).
The fractal structure of coral reefs, with its increased surface area, significantly boosts photosynthetic efficiency. This is because corals host zooxanthellae, microscopic algae, in their tissues. The algae use this expanded surface area to perform more effective photosynthesis, converting sunlight and CO2 into energy, essential in nutrient-poor marine environments. Additionally, the larger surface area aids in absorbing nutrients more effectively and enhances gas exchange, allowing corals to better absorb oxygen and expel carbon dioxide. These processes are crucial for the health and growth of coral reefs (Brown et al., 2002).
Specific case study: elkhorn coral (Acropora palmata)
One striking example of fractal geometry in branching corals is the Elkhorn Coral, Acropora palmata. This species, named for its resemblance to the antlers of an elk, showcases a highly intricate branching structure. Each branch of the Elkhorn Coral divides into smaller branches, which in turn branch out further, creating a complex, tree-like pattern. This fractal design significantly enhances the coral's surface area. The increased surface area provides a larger area for the symbiotic zooxanthellae algae to conduct photosynthesis and facilitates more efficient nutrient absorption from the water. The fractal branching pattern of the Elkhorn Coral is not just an aesthetic marvel. It is a functional adaptation that optimizes the coral's ability to thrive in its marine environment, balancing the need for growth and structural stability against the challenges of nutrient scarcity and physical stress (Figure 9) (NOAA Fisheries, 2014).
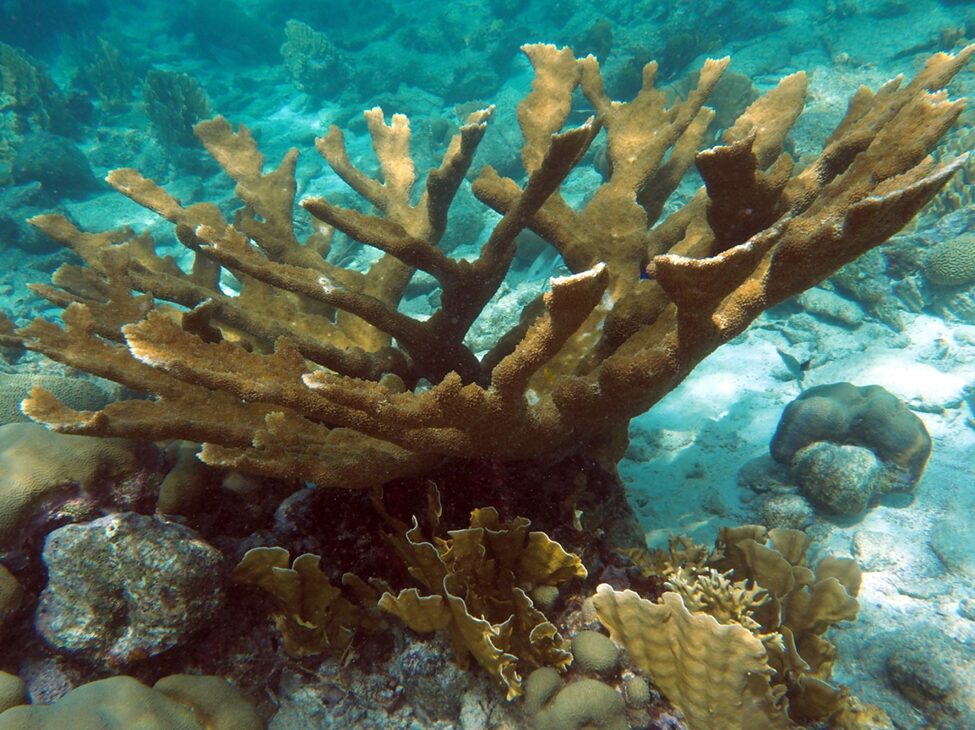
Fig. 9 The Elkhorn Coral (Acropora palmata), showcasing its characteristic antler-like branching structure. This fractal pattern effectively increases the coral's surface area (NOAA Fisheries, 2014).
Hyperbolic geometry of coral species
Describing hyperbolic geometry
From the roads we drive on, to the buildings we live in, the world around us predominantly consists of straight lines and rectilinear forms. This is properly understood as Euclidean geometry, which is a mathematical system attributed to the ancient Greek mathematician Euclid. This geometry accurately defines the interactions of points and lines on a flat two-dimensional surface and can be expanded to three dimensions, serving as a mathematical framework for the physical world. Euclid's fifth postulate (parallel postulate) describing this geometric system gave rise to one of the most significant debates in the history of science. If you have a line (l) and a point (P) that is not on that line, the postulate asserts that you can draw a unique line (m) through point (P) in such a way that it never intersects or crosses line (l) (Figure 10) (Zassman, 2020).
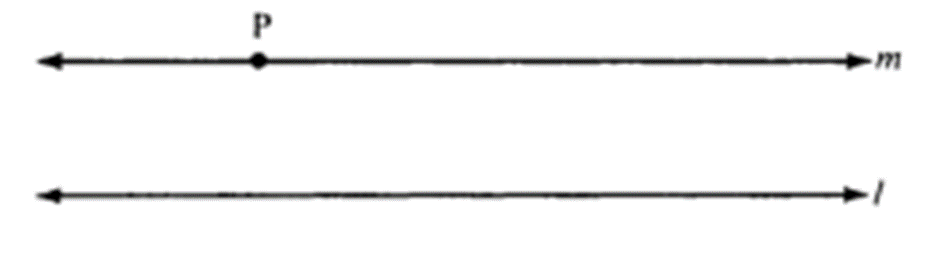
Fig. 10 Parallel lines (l) and (m) according to Euclidean space (Zassman, 2020).
Unlike the other four postulates, which can be proven or demonstrated, the parallel postulate is more complex and cannot be proven empirically when working with finite segments. This is because, in practice, it is challenging to show that two lines are truly parallel since they might appear to converge when extended further. After grappling with this issue for nearly two millennia, the breakthrough came when mathematicians realized that they did not have to assume that geometry had to be exclusively Euclidean. The concept of a non-Euclidean, hyperbolic geometry thus came into fruition and was built around a newfound version of the parallel postulate, which states that there can be multiple lines that pass through a single point that is parallel to the same line. More explicitly, for any line (l) and any point (P) not on (l), there are at least two distinct lines that pass through (P) and are parallel to (l) (Figure 11) (Zassman, 2020).
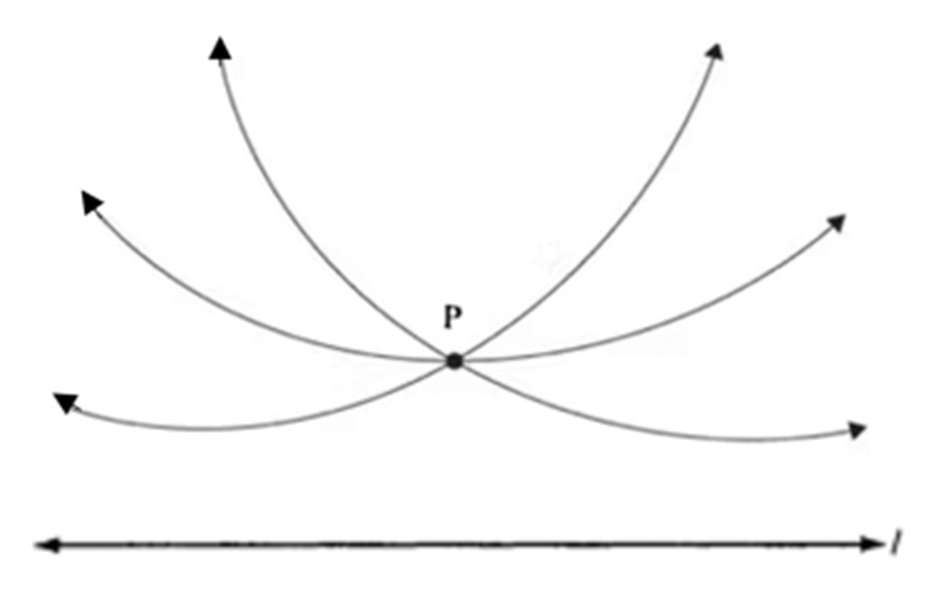
Fig. 11 Lines passing through (P) are parallel to the line (l) according to non-Euclidean, hyperbolic space. The lines only look curved because they result from the projection of an image of a curved surface onto a flat plane (Zassman, 2020).
Euclid's postulates were long considered the absolute foundation of geometry. When new geometrical concepts were proposed, they were initially met with skepticism, as they challenged the long-standing norms in the field of mathematics. As hyperbolic geometry became more widely accepted, mathematicians started searching for ways to create models of the hyperbolic plane. This task, however, proved to be exceptionally challenging due to the distinctive nature of hyperbolic geometry. Hyperbolic forms continue infinitely without ever converging upon themselves and are also characterized by a negative curvature (Figure 12). A surface has negative curvature at a point if the surface curves away from the tangent plane in two different directions (Zassman, 2020).
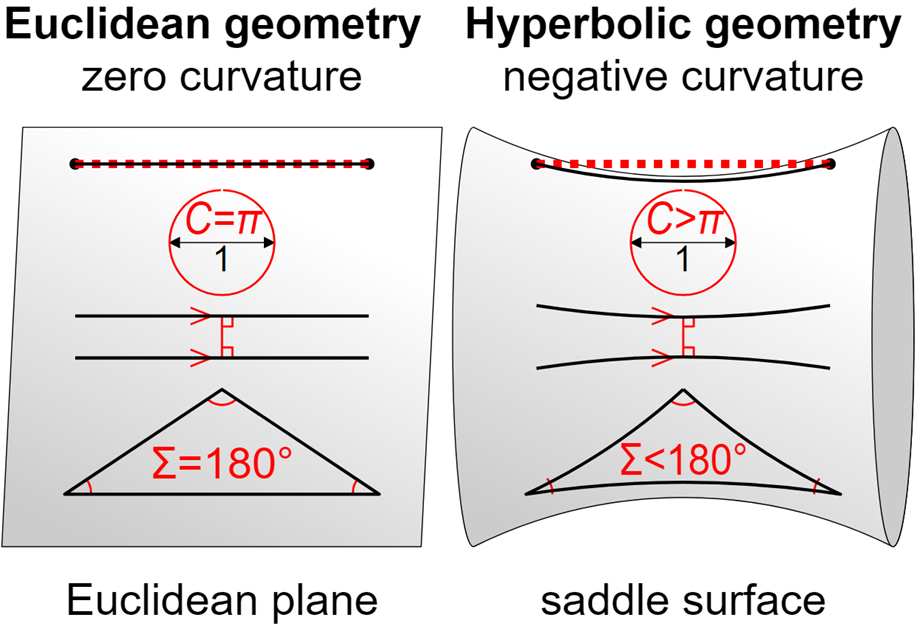
Fig. 12 Comparison of Euclidean and hyperbolic geometries in two dimensions. In Euclidean geometry, (1) the plane exhibits zero curvature, (2) the circumference of a circle with diameter 1 is π, (3) parallel lines remain at a constant distance, never meeting, (4) and the sum of angles in a triangle is 180 degrees. In hyperbolic geometry, (1) the plane has negative curvature, (2) the circumference of a circle with diameter 1 is greater than π, (3) parallel lines diverge, indicating they would not remain equidistant and would not meet, (4) and the sum of the angles in a triangle is less than 180 degrees (Wikipedia Contributors, 2019).
Application to coral species
For a long time, mathematicians found it challenging to embrace the concept of non-Euclidean geometry. However, this concept is not just theoretical as various organisms in nature are representative of the hyperbolic plane. More specifically, many kinds of marine life exhibit this fascinating type of structure, including certain coral species (Figure 13). Hyperbolic forms are advantageous in situations where having a large surface area is beneficial, especially for filter-feeding animals that depend on tiny food particles suspended in water. The elaborate swooping and curving forms arise from the negative curvature inherent to hyperbolic geometry, promoting a proliferation of folds and indentations that amplify the surface area. Having a large surface area is beneficial for filter feeding, as it enables the organism to interact with a greater volume of water and consequently, more food particles (Zassman, 2020). Additionally, the intricate, frilly characteristics of the hyperbolic structure aid in the growth of coral. In the crowded environment of a reef, where space is limited, corals need room to expand and thrive. Some coral species have developed sophisticated strategies to compete for this limited space. Hyperbolic shapes enable these organisms to maximize their surface area without occupying excessive space in the ocean, allowing them to flourish while conserving room for other marine life. This trait is an adaptive advantage in the competitive ecosystem of a coral reef (Zassman, 2020).
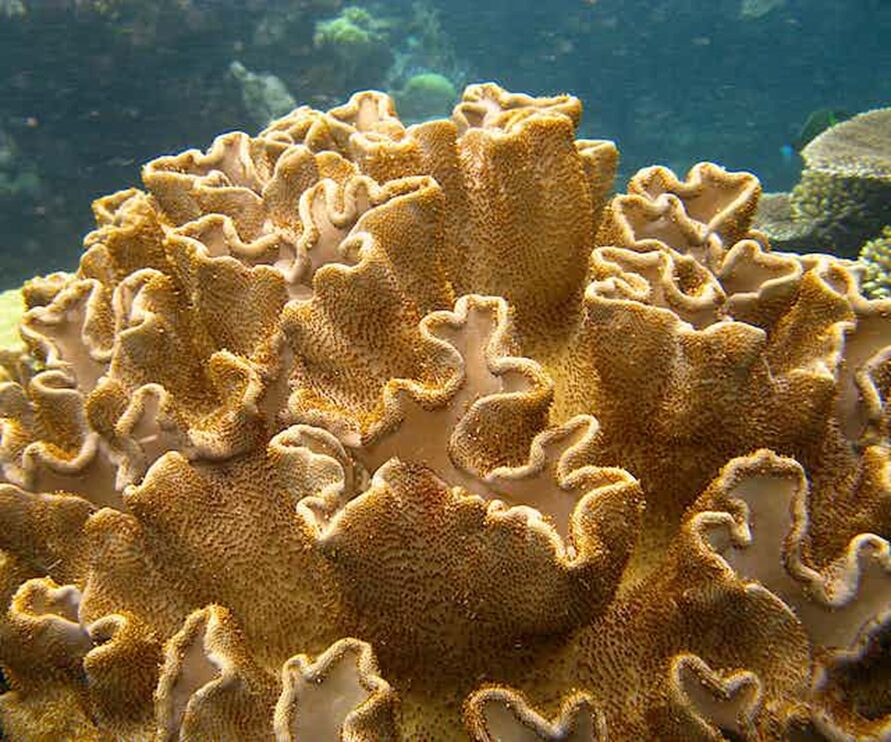
Fig. 13 The frilly forms of corals and sponges are biological variations of hyperbolic geometry, as seen here on genus Sarcophyton in Flynn Reef, part of the Great Barrier Reef, near Cairns, Queensland, Australia (Hudson, 2010).
Future works
Several types of coral are naturally occurring models of the hyperbolic plane. Researchers can observe the intricate shapes of these corals in their natural habitats, noting the characteristics that align with hyperbolic geometry, but they have yet to understand if hyperbolic structures are unique to a specific type of coral and how these structures form during coral growth (Zassman, 2020). Digital modeling and simulations can help with this, but there needs to be a greater understanding of the various species of corals that have the hyperbolic form. Zassman suggests that the current models are limited by the lack of detailed quantitative data on how external factors affect coral growth. As a result, this limitation prevents models and simulations from fully understanding the impact of these conditions on coral development (Zassman, 2020).
Conclusion
Millions of corals can make up coral reefs and to therefore grow to such sizes, corals must find ways to grow in more consistent manners rather than completely random and unstable manners. Corals can achieve greater levels of consistency in their growth as a result of the “polyp fanning effect” at convex sites. This curvature effect emerges as a result of competition for nutrients that are present at concave sites. This consistent growth is important for colonial organisms and corals can achieve an enhanced sense of consistency through the “polyp fanning effect.”
Corals are facing tougher conditions now more than ever with climate change and global warming. They face that problem by producing more melanin and fluorescent proteins, but is that enough? From equation (5), it is deduced that polyps can adapt to these changing conditions depending on the rate of change. If the change is too rapid the corals cannot keep up and results in their demise. This is a serious indicator to care for the planet and actively work to limit the effects of climate change as it is warming up too fast for nature to catch up.
Corals, facing the challenges of nutrient scarcity and physical stress in ocean depths, have adapted a unique design solution in fractal geometry. This adaptation, characterized by self-similar patterns that scale across the coral structure, effectively increases the surface area for critical processes like photosynthesis, nutrient absorption, and gas exchange. This intelligent evolutionary response showcases nature's capacity to overcome environmental constraints and sustain the vibrant ecosystem of coral reefs.
Corals in reef ecosystems face the challenge of finding sufficient space to grow and access food through filter-feeding, all within the confines of a competitive environment. Their evolution of hyperbolic forms is a clever adaptation, expanding surface area for feeding and growth without consuming excessive space, ensuring their survival alongside a myriad of marine species.
References
Brown, J. H., Gupta, V. K., Li, B.-L., Milne, B. T., Restrepo, C., & West, G. B. (2002). The fractal nature of nature: power laws, ecological complexity and biodiversity. Philosophical Transactions of the Royal Society of London. Series B: Biological Sciences, 357(1421), 619–626. https://doi.org/10.1098/rstb.2001.0993
Cropp, R., & Norbury, J. (2020). The potential for coral reefs to adapt to a changing climate – an eco-evolutionary modelling perspective. Ecological Modelling, 426, 109038. https://doi.org/10.1016/j.ecolmodel.2020.109038
Florida Fish and Wildlife Conservation Commission. (2022). What are Corals? Florida Fish and Wildlife Conservation Commission. https://myfwc.com/research/habitat/coral/news-information/what-are-corals/#:~:text=Most%20species%20of%20coral%20are
Garcia-Soto, C., Cheng, L., Caesar, L., Schmidtko, S., Jewett, E. B., Cheripka, A., Rigor, I., Caballero, A., Chiba, S., Báez, J. C., Zielinski, T., & Abraham, J. P. (2021). An Overview of Ocean Climate Change Indicators: Sea Surface Temperature, Ocean Heat Content, Ocean pH, Dissolved Oxygen Concentration, Arctic Sea Ice Extent, Thickness and Volume, Sea Level and Strength of the AMOC (Atlantic Meridional Overturning Circulation). Frontiers in Marine Science, 8. https://doi.org/10.3389/fmars.2021.642372
Hamlet, C. L., Strickland, W. C., Battista, N., & Miller, L. A. (2023). Multiscale flow between the branches and polyps of gorgonians. Journal of Experimental Biology, 226(5). https://doi.org/10.1242/jeb.244520
Hudson, T. (2010, July 24). English: Sarcophyton in Flynn Reef, part of the Great Barrier Reef, near Cairns, Queensland, Australia. Wikimedia Commons. https://commons.wikimedia.org/wiki/File:Folded_Coral_Flynn_Reef.jpg
KAANDORP, J. A., & SLOOT, P. M. A. (2001). Morphological Models of Radiate Accretive Growth and the Influence of Hydrodynamics. Journal of Theoretical Biology, 209(3), 257–274. https://doi.org/10.1006/jtbi.2001.2261
Lyndby, N. H., Kühl, M., & Wangpraseurt, D. (2016). Heat generation and light scattering of green fluorescent protein-like pigments in coral tissue. Scientific Reports, 6(1). https://doi.org/10.1038/srep26599
Merks, R. M. H., Hoekstra, A. G., Kaandorp, J. A., & Sloot, P. M. A. (2004). Polyp oriented modelling of coral growth. Journal of Theoretical Biology, 228(4), 559–576. https://doi.org/10.1016/j.jtbi.2004.02.020
Merks, R., Hoekstra, A., Kaandorp, J., & Sloot, P. (2003). Models of coral growth: spontaneous branching, compactification and the Laplacian growth assumption. Journal of Theoretical Biology, 224(2), 153–166. https://doi.org/10.1016/s0022-5193(03)00140-1
Nature Foundation. (2023, November 7). Nature Foundation St. Maarten-Coral Reefs. Nature Foundation St. Maarten. https://naturefoundationsxm.org/category/ecosystems/coral-reefs/
Nieves-González, A., Ruiz-Diaz, C. P., Toledo-Hernández, C., & Ramírez-Lugo, J. S. (2019). A mathematical model of the interactions between Acropora cervicornis and its environment. Ecological Modelling, 406, 7–22. https://doi.org/10.1016/j.ecolmodel.2019.04.004
NOAA Fisheries. (2014). Elkhorn Coral | NOAA Fisheries. Noaa.gov. https://www.fisheries.noaa.gov/species/elkhorn-coral
Purkis, S., Riegl, B., & Dodge, R. (2006). Fractal Patterns of Coral Communities: Evidence from Remote Sensing (Arabian Gulf, Dubai, U.A.E.) Part of the Marine Biology Commons, and the Oceanography and Atmospheric Sciences and Meteorology Commons.
Sous, D., Bouchette, F., Doerflinger, E., Meulé, S., Certain, R., Toulemonde, G., Dubarbier, B., & Salvat, B. (2020). On the small‐scale fractal geometrical structure of a living coral reef barrier. Earth Surface Processes and Landforms, 45(12), 3042–3054. https://doi.org/10.1002/esp.4950
Wikipedia Contributors. (2019, November 20). Hyperbolic geometry. Wikipedia; Wikimedia Foundation. https://en.wikipedia.org/wiki/Hyperbolic_geometry
Zassman, S. (2020). The Hyperbolic Structure of Corals. https://saralin.ca/static/media/Written-Report-Zassman-665.f4712f34.pdf