


Abstract
Pincers (alternatively known as chelae) are an integral component of many arthropod species. Many species, from arachnids to crustaceans, rely on the chelae for survival. Chelae are a highly functional and morphologically diverse group of structures found in crustaceans whose functions range from cracking open coconuts in coconut crabs to acting as protective gates for shells inhabited by hermit crabs. The chelae require highly reinforced, layered structure to complete these tasks. This highly adaptive evolutionary tool can be analyzed in a multitude of ways to grasp the mechanical and biochemical properties that have ensured the survival of arthropods for millions of years. For example, an allometric analysis of the features of pincer-wielding species or a morphological investigation of the chelae is highly constructive for unveiling the wonders of this tool which can be applied to modern innovations and advancements. The use of game theory-based models enables further extrapolation of individual armament evolution and the factors which influence the degree of development. The following paper explores the details of the allometry, morphometry, and game theory of the pincer and pincer-wielding species.
Introduction
Biological tools have been developed and refined over hundreds of thousands of years to maintain species’ survival. Because natural resources are limited, competition between species is inevitable. Darwin’s evolutionary mechanism of natural selection prefers traits that increase a species’ chances of survival and reproduction as traits are passed on from generation to generation. These traits are inherited until external changes make them either less favorable or more favorable. Favorable traits entering the gene pool lead to species adaptation and evolution (Ashraf & Sarfraz, 2016). One example of this is the emergence of pincers or chelae.
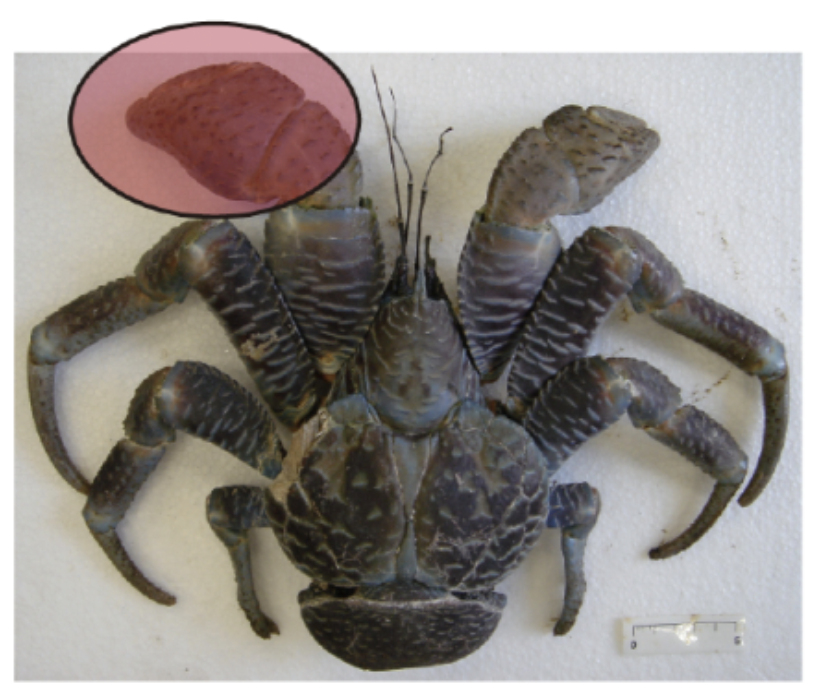
Pincers are most commonly used as weapons and hunting tools by pincer-wielding arthropods. These weapons are often used to trap or capture. Many crustaceans, such as the Birgus latro, or coconut crabs, use pincers to hunt and gather. As the largest terrestrial crustacean, coconut crab chelae are huge. They have adapted to acquire food in plants with hard exteriors and serve as a weapon against other terrestrial species. These mighty creatures are known to have the strongest chelae with the ability to exert forces up to 800 N. These substantial chelae of the coconut crab are shown in Figure 1 (Oka et al., 2016).

Fig. 1 Birgus Latro, the coconut crab. The major chela of this specimen is highlighted in red (Oka et al., 2016).
Many organisms also use their chelae for defense, such as the Coenobita brevimanus, a species of hermit crab that employs their chelae as a biological shield. This species is shown in Figure 2, which highlights the remarkable feature of their chelae, the left chela being much larger than the right one. When in a defensive position, the hermit crab will use its excessively large left chela as a blockade by covering the entrance of the shell (Reshmi & Bijukumar, 2010). Chelae-wielding species frequently engage in sexual competitions and communicate with one another. They are particularly utilized in signals of mating and competition with other animals of the same sex. The fiddler crab Uca pugnax, for instance, uses its major (larger) pincers as fighting and mating cues. In addition to demonstrating the crab’s ability to fight and intimidate enemies, the chelae’s generous size and bright color are essential characteristics that attract potential mates (Levinton & Allen, 2005).
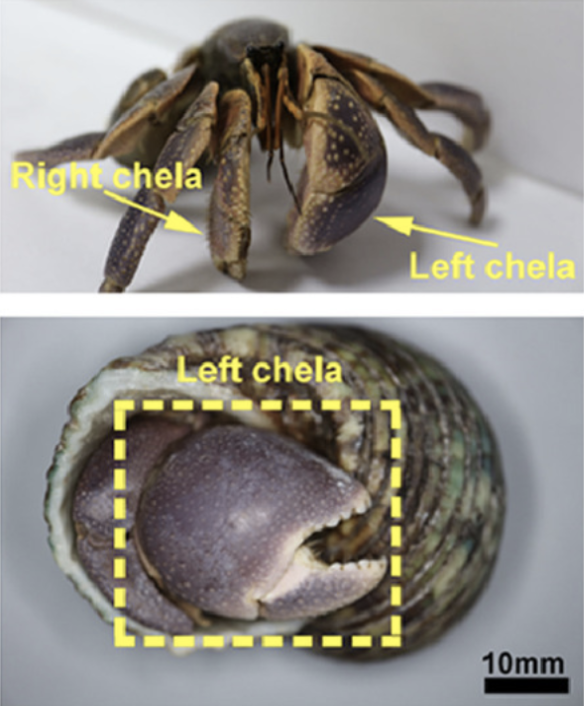
Fig. 2 Photographs of hermit crab outside of the gastropod shell and retracted inside. Note the disproportionately large left chela in (A) and its retracted position in (B) covering the shell entrance (Lin et al., 2021).
This paper will explore the allometry, morphology, and geometric morphometrics of the pincer. For example, there will be an analysis of the morphometrics of pincers of multiple species of crustaceans, specifically the Fiddler Crab. Additionally, the relationships between the mechanical properties of pincers will be examined, such as force production in coconut crabs, and the size of chelae and the chelae-wielding organisms via allometric equations. Lastly, there will be a discussion of game theory involving pincers and aggression within pincer-wielding species.
Allometry
What is allometry?
Allometry is a broad study that aims to describe how characteristics of living organisms vary with size. Allometry is often applied to the study of biology-related scaling relationships, such as physiological traits, morphological traits or ecological traits, to better understand the mechanisms that create this scaled relationship, their influence on ecology and their effect on evolution (Shingleton, 2010).
The allometric equation:
The study of allometry was unified under a cohesive concept with universal terminology by Huxley and Georges (Huxley, 1925; Huxley & Teissier, 1936). The allometric equations described the relationship between two measured quantities.
The power law equation:
\begin{equation}
y=kx^a
\end{equation}
or in a logarithmic form:
\begin{equation}
\log(y)=a\log(x)+\log(b)
\end{equation}
In the above equations, x and y represent the two attributes being compared and α is the allometric coefficient. For example, x can be the size of the body of an organism and y can be the size of the organ of interest. The latter (2) is a linear equation where log(b) is the intercept of the line on the y-axis and where α is the slope of the line (The Biology Project, 2005). It turns out that, when plotted on a logarithmic scale, many scaling relationships encountered in nature can be described by this linear equation (Kerkhoff & Enquist, 2009; O’Hara & Kotze, 2010). However, not all allometries are linear on a log-log scale. Nonlinear allometries may be sigmoidal or discontinuous (Chappell, 1989; Garland, 1983).
If α is greater than 1, the attribute specified by y will increase disproportionately to the attribute specified by x. When 0 < α < 1, attribute y increases with attribute x, but more slowly than proportionally. For α = 1, attribute y varies as a constant proportion of attribute x (Shingleton, 2010). Figure 3 illustrates the allometry of the height with respect to width in a set of triangles.

Fig. 3 Allometry of height versus width in a set of triangles. The red line illustrates hyperallometry of height versus width with a slope α > 1. The blue line illustrates hypoallometry between height and width with a slope α < 1. The grey line is an example of isometry where the slope α = 1 (Klingenberg, 2016).
Plotting the variation in body size and the size of an organ of interest at different developmental stages visually and mathematically describes the differential growth ratio between the organ and the body of the organism. Positive allometry or hyperallometry is the case where the organ of interest has a higher rate of growth than the body. The graph of such a relationship is characterized by a slope α >1. This is the case for the chelae of the male fiddler crab as can be seen in Figure 4 (Shingleton, 2010).

Fig. 4 Allometric relationship between chela size and body size in male fiddler crab (Uca pugnax) throughout its growth. The red lines on the drawings indicate the measurements that were taken of the crab. Relationship between chela and body size displayed on the linear graph can be described by an allometric equation. The allometric coefficient is 1.57, indicating a hyperallometric relationship. The solid line represents an isometric relationship with an allometric coefficient equal to 1 (Shingleton, 2010).
The linear slope of the line of green points is larger than 1, indicating a hyperallometric relationship between chelae growth and body growth of the fiddler crab. In other words, the chelae grow at a faster rate than the rest of the body and as a result, the chelae size is exaggerated with respect to the size of its body (Shingleton, 2010).
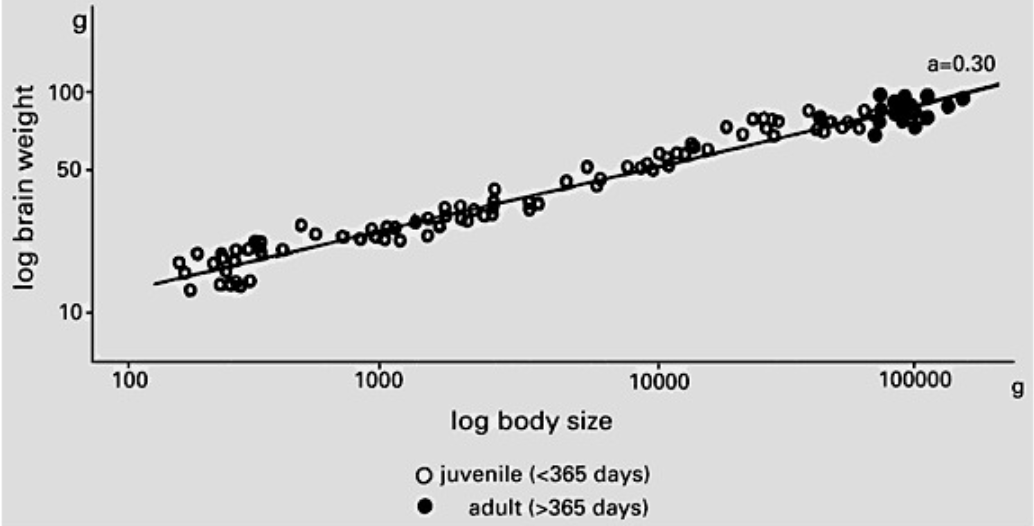
Negative allometry or hypoallometry is the case when the organ has a lower rate of growth than the body. The equation describing a hypoallometric relationship is characterized by having a slope α < 1. This applies to organs that, after birth, grow more slowly than the rest of the body, the brain of a pig for instance (Figure 5). If the rate of growth of the organ of interest is the same as the overall growth of the rest of its body, this condition is referred to as isometry. An organ that grows isometrically thus maintains a constant proportional size with respect to the rest of the body throughout development but does undergo an increase in absolute size. The allometric constant of such a relationship α = 1 (Shingleton, 2010).

Fig. 5 The brain growth relative to the body in the precocial Vietnamese pot-bellied pig. The brain grows in a hypoallometric manner to body size, with an allometric coefficient (a) of 0.30. This explains why the head becomes proportionally smaller as the pigs develop and grow (Kruska, 2005).
In determining if isometry or allometry is present for a given trait, it is necessary to have an expected value for the scaling relationship to compare data to and determine if it deviates from said expected value. Methods of dimensional analysis—mathematical methods of evaluating the relationships between different quantities—are usually applied to obtain these values (Gibbings, 2011).
Broadening of Allometry
The term allometry is typically used to refer to scaling relationships in general, even when the variation in a trait is not studied with respect to the developmental progression of a single individual. When the relationship between traits is measured in the same individual throughout their development, the relationship is referred to as ontogenetic allometry. In this case, the allometric coefficient represents the difference in growth rate between the two traits. When the relationship is measured within a given population/species in different individuals at the same developmental stage, it is referred to as static allometry. This type of allometry reflects how the variation in one trait size is accompanied by variation in the other trait (usually body size) within a population/species.
When the relationship between traits is studied in different species, it is referred to as evolutionary allometry. This type of allometry reflects how the variation in one trait size is accompanied by variation in the other trait (usually body size) between species (Shingleton, 2010).
All three of these types of allometry are indeed often related; however, the allometric relationship of a trait with respect to another won’t necessarily be the same in all three forms of allometry (Figure 6).
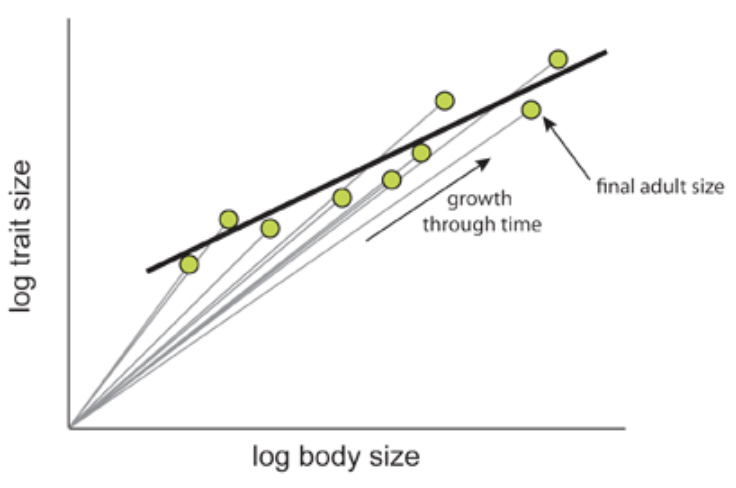
Fig. 6 The relationship between ontogenetic and static allometry. The ontogenetic allometry of brain size with respect to body size of individuals of the Asian house shrew, Suncus murinus, is depicted with straight grey lines, as both grow during development. The slopes of these lines are larger or equal to 1. The green points indicate the final brain to body size relationship of a fully grown Suncus murinus individual. The static allometry of the brain size and body size is depicted with the black line, plotted using the green points. The slope of this line is smaller than 1, thus making the relationship hypoallometric (Shingleton, 2010).
Morphological Allometry and the Evolution of Body Form
Allometry is very often applied to study morphology. Animals belonging to the same taxon often share a similar body plan. Their bodies are overall arranged in a similar way. However, the diversity between species is very large. A large part of this diversity results from changes in the relative size of the different parts of their bodies. This variation can be described with static allometry, the study of variation among individuals of the same age class (Shingleton, 2010).
Take mammals for instance. All mammals (almost) have seven vertebrae in their neck. However, the difference between the necks of different species is enormous, like between the neck of a giraffe and that of a seal. This difference has to do with the size of the vertebrae in relation to overall body size. So, it can be argued that the evolution of morphology results from the evolution of static allometry, among individuals of the age class, which, in turn, emerges from the variation in ontogenetic allometry (Shingleton, 2010).
Geometric Morphometrics
Recording and analyzing measurements taken for the study of allometry often requires using geometric morphometric methods. Morphometry quantitatively analyses size and shape, the combination of which into one related concept is referred to as form (Rohlf, 1990).
In his paper, “Fiddler crab claw shape variation: a geometric morphometric analysis across the genus Uca (Crustacea: Brachyura: Ocypodidae),” reviewed in this paper, Michael S. Rosenberg (2002) studied the allometry of the pincer variation across the fiddler crab genus Uca. Geometric morphometrics were used to describe shape and size.
To describe the proportion and spatial distribution of the shapes of the pincers, landmark-based geometric morphometrics were used. Six landmarks, discrete anatomical loci that are homologous in the individuals studied, were chosen from the chelae of the studied specimens (shown in Figure 7), and their coordinates were recorded and compared using Procrustes’ superimposition (Rosenberg, 2002).
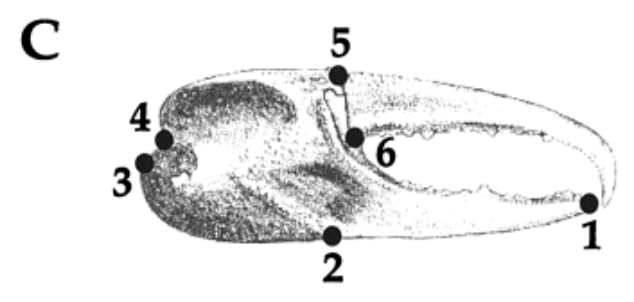
Fig. 7 Landmark data collected from each claw. (1) tip of the pollex; (2) the junction between the manus and the pollex on the ventral side of the claw; (3,4) the upper and lower attachments of the carpus with the manus; (5,6) the lower and upper points of the joint of the dactyl. These landmarks were chosen because they are relatively easy to identify in all species studied, are relatively homologous in all species and because this suite of landmarks allows the capture of the general shape of the chelae. These landmarks were then optimally superimposed and compared using Procrustes analysis (Rosenberg, 2001).
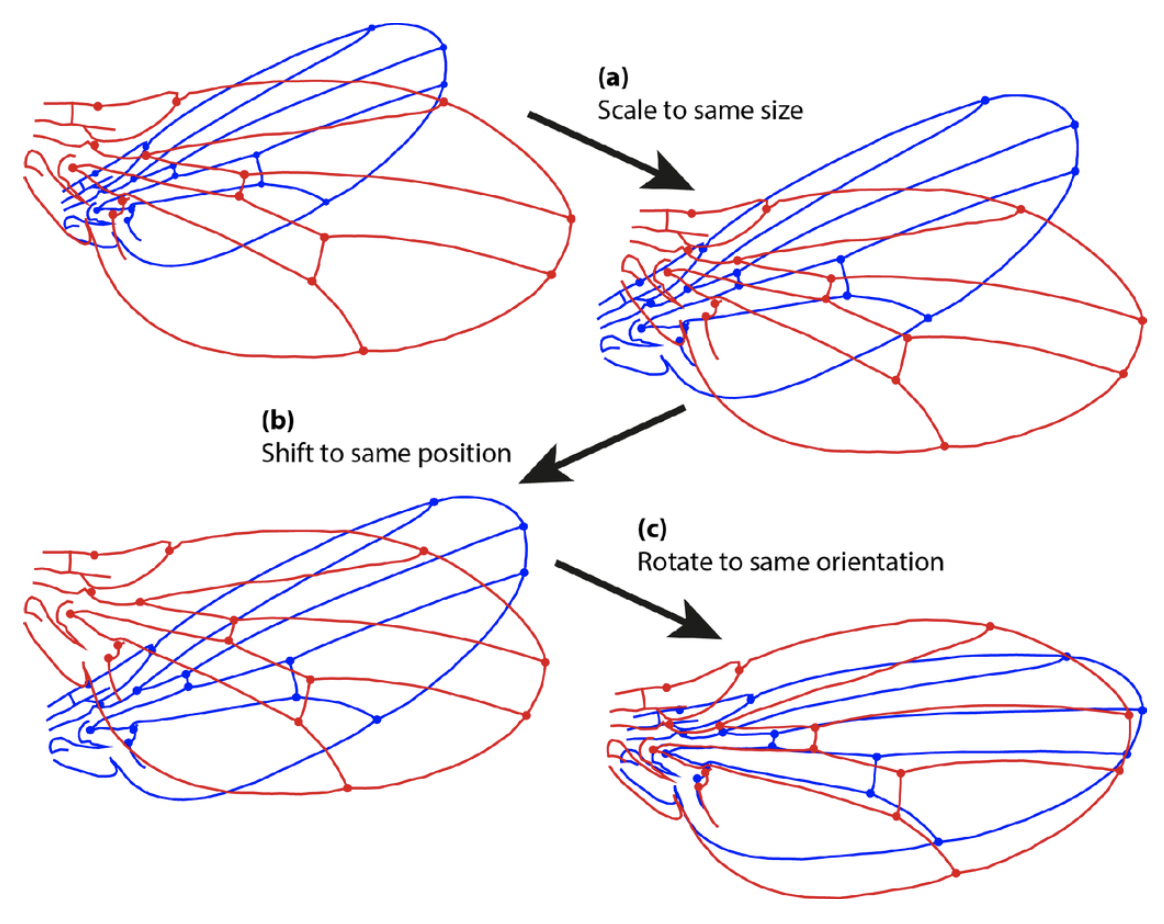
Procrustes’ superimposition allows for the shape to be studied by removing unnecessary and confounding information such as scaling and rotation. Usually, such methods involve some systematic superimposing of rescaled, rotated and aligned shapes and analyzing using multivariate statistical methods such as PCA (principal component analysis) to summarize the variation (Figure 8) (Ross, 2004).

Fig. 8 Example of Procrustes’ superimposition and the steps of a general Procrustes fit. (a) Scaling of both configurational sets of landmarks to the same size; (b) Transposition of the configurations to a common centroid; (c) Rotation in the orientation as to minimize the sum of squared distances between corresponding landmarks (Klingenberg, 2015).
Findings on the Fiddler crab claw shape variation across species
As mentioned above, the article “Fiddler crab claw shape variation: a geometric morphometric analysis across the genus Uca (Crustacea: Brachyura: Ocypodidae)” discusses the allometry of this crustacean’s pincer. Researcher Michael Rosenberg (2002) studied 1652 claws of (mostly) male fiddler crabs, analyzing 88 out of 97 fiddler crab species known. Figure 9 below demonstrates the wide variety of major claws found in the Uca genus (fiddler crab). This large sample size allowed for a comprehensive inspection of claw allometry within a species throughout its life (ontogenetic allometry) and between species (static allometry).
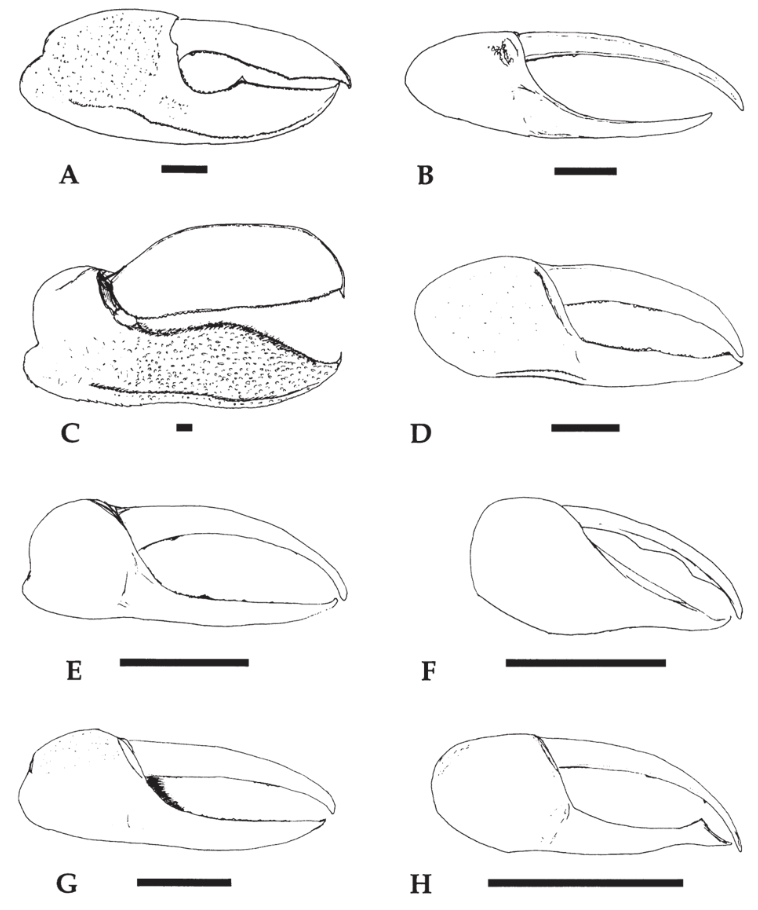
Fig. 9 Major claws from different species of Uca (fiddler crab). The black horizontal bar represents 5 mm. (A) Uca stylifera; (B) Uca festae; (C) Uca ornata; (D) Uca herradurensis; (E) Uca terpsichores; (F) Uca saltitanta; (G) Uca beebei; (H) Uca batuenta. (Rosenberg, 2002).
Anatomy of the Crab Pincer
Before analyzing the allometric patterns of the crab, it is necessary to identify the key players studied. The crab claw can be broken down into the following regions, as shown in Figure 10(A): the dactyl, the movable finger; the pollex, the section below the dactyl; the gape, the opening between the dactyl and pollex; the manus; and the carpus (Rosenberg, 2002).
Measurements for allometry were made by comparing the centroid size of the landscape points and the carapace breadth. The centroid size is calculated by the square root of the sum of the squared distances between each landmark and the centroid of the landmark configuration (Rosenberg, 2002). The carapace is the main body cavity of the crab, as shown in Figure 10(B) and Figure 11, and will allow a comparison of pincer size to the overall crab size.

Fig. 10 Diagram of fiddler crab components. (A) Right major claw outside surface and (B) dorsal view of the carapace (Rosenberg, 2002).

Fig. 11 Fiddler crab carapace (red) diagram. The major claw (right) is the larger pincer that is used for performance, and the minor claw (left), the smaller, is for practical uses such as feeding (Crane, 2015).
Size Allometry
The analysis of size allometry corresponds to how big or small the crab’s claw is with respect to its growth or other species. It was found that the major claw’s size followed allometric trends within and among species. The minor claw, however, appeared to grow isometrically in size. These trends are observed in the graphs below (Figure 12A, B), where slopes higher than 1 indicate an allometric pattern. The carapace size was compared to the centroid size for the major pincer (black) and the minor pincer (white). For all species, the major claws had slope regressions higher than 1.5, while that of the minor claws was ~1. Therefore, it was determined that within a species, the major claw grows with positive allometry, while the minor claw grew isometrically (Rosenberg, 2002). These differences in size proportionality explain why we see a fiddler crab sporting one larger claw and one smaller claw.
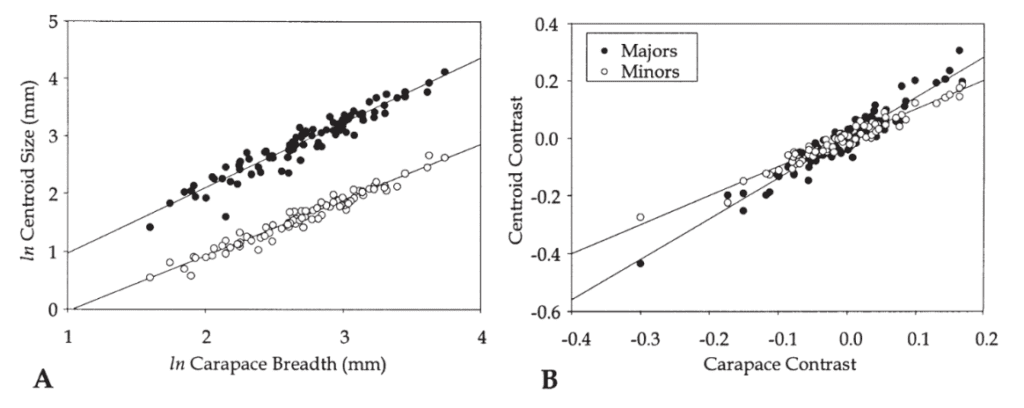
Fig. 12 Regression of centroid size on carapace breadth for the species means. (A) Regressions of ln centroid size on ln carapace breadth. (B) Regressions of contrast scores of ln centroid size on ln carapace breadth. (Rosenberg, 2002).
Shape Variation and Allometry
Like size allometry, shape allometry analyzes variation in the claw with respect to the growth of the crab. Shape allometry within a species can be seen as a portion of the claw growing disproportionately to the rest as the crab ages. Across species, shape allometry is an indication of species having longer or shorter chela as an evolutionary consequence (Rosenberg, 2002).
Within species, the major claw showed allometry, while isometry was observed for the minor claw. These findings are parallel to the size variation of major and minor claws. Across species, it was found, however, that both major and minor claws showed an allometric pattern. The morphometric grids of Figure 13 below, demonstrate the relationship between the pincers’ average shape and the species’ size. Each black point represents the landmark previously described (Figure 7). As we can observe, as species get larger, the pollex becomes relatively longer while the carpus becomes smaller for both major and minor claws (Rosenberg, 2002). This allometry likely allows some species to be better at yielding greater forces while others have a faster closure.

Fig. 13 Plot of landscape configuration of Major and Minor claw shape. The central plot demonstrates the mean claw shape. The other configurations illustrate the shape change represented by increasing or decreasing centroid size. As the crab increases in size, the pollex becomes longer and the carpus smaller (Rosenberg, 2002).
Biological Scaling of Forces Produced by Pincers
As seen in the paper “Review of the Mechanical, Structural, and Physical Properties of Pincers: An Evolutionary Wonder”, pincers can exert a large amount of force, depending on their function. The forces produced by crustaceans and their predatory behaviour are associated with the morphology of the chelae. Based on their diet and environmental differences, crustaceans have varied chelae structures that allow them to produce the forces required for their survival (Elner & Campbell, 1981).
One of the highest force-producing crustaceans is Birgus latro or the coconut crab. This crab can use its chelae to lift 30 kg, and the force exerted by a giant coconut crab (4 kg) can be up to 3300 N (Oka et al., 2016). Although the forces exerted by the chelae of crustaceans vary greatly, it is predominantly determined by the pincer size and, therefore, the specimen’s size.
In the pincers of the coconut crab, the pinching forces are exerted by the closure of a moveable finger, the dactyl. The dactyl, the stationary finger, and connected closer muscles form a permanently closed kinematic chain that provides mobility for the dactyl and stability for the system during adduction and abduction. The tremendous forces exerted by the pincers of the coconut crab are created by stresses in the closer muscle. They can be analyzed via the sliding filament model of muscle contraction, which explains that maximum muscle stress should increase isometrically with the sarcomere, or muscle length, as long as other factors are constant (Taylor, 2000). The increase should be constant with changes in the muscle length because there is a linear relationship between stress and the overlap of filaments within the muscle. This is accurate in coconut crabs and explains their exceptionally high force production as they have a considerable concentration of muscle fibers featuring particularly long sarcomeres (Oka et al., 2016).
A study on the strength of these pincers focuses on the mathematical modeling of the forces they exert and the mathematical relationships between body weight, claw length, height, and width. In these relationships and subsequent graphs, data is taken from a population of both sexes, as sexual dimorphism with respect to chelae morphology or claw measurements was not found in this population of coconut crabs (Oka et al., 2016). Additionally, in this study, the pincers, or chelae, are commonly referred to as claws. For the continuity between the language and the equations, in this section, the pincers will frequently be referred to as claws.
Muscle stress in the coconut crab can be calculated using Equation (I), where F is the force exerted on the base of the dactyl, estimated from the relationship between pinching force, body weight, and mechanical advantage. A is the area of one side of the closer apodeme and is the mean angle of the fiber attached to the closer apodeme of the chelae (Taylor, 2000).
\begin{equation} \tag{i}
S=\frac{F}{A\sin\sin2\theta}
\end{equation}
In the remainder of this study, allometric equations were used to examine the coconut crabs’ claw mass index, body weight, and pinching force. As discussed earlier, allometric equations are commonly used to study the relative change in the relationship of one attribute to another. These attributes may be morphological, physiological, or otherwise. The form of this allometric equation is displayed in (ii), where x and y represent the two attributes being compared, and a is the scaling factor between these attributes. If a is greater than 1, the attribute specified by y will increase disproportionately to the attribute specified by x. When 0 < a < 1, attribute y increases with attribute x, but more slowly than proportionally. For a = 1, attribute y varies as a constant proportion of attribute x. In this case, the relationship is called isometric rather than allometric. Converting these equations to logarithmic equations gives linear equations of the form log(y) = alog(x) + log(k) or y = ax + k. Using a log-log plot, the allometric equation forms a straight line with a slope equal to a and a y-intercept equal to log(k) (The Biology Project, 2005).
\begin{equation} \tag{ii}
y=kx^a
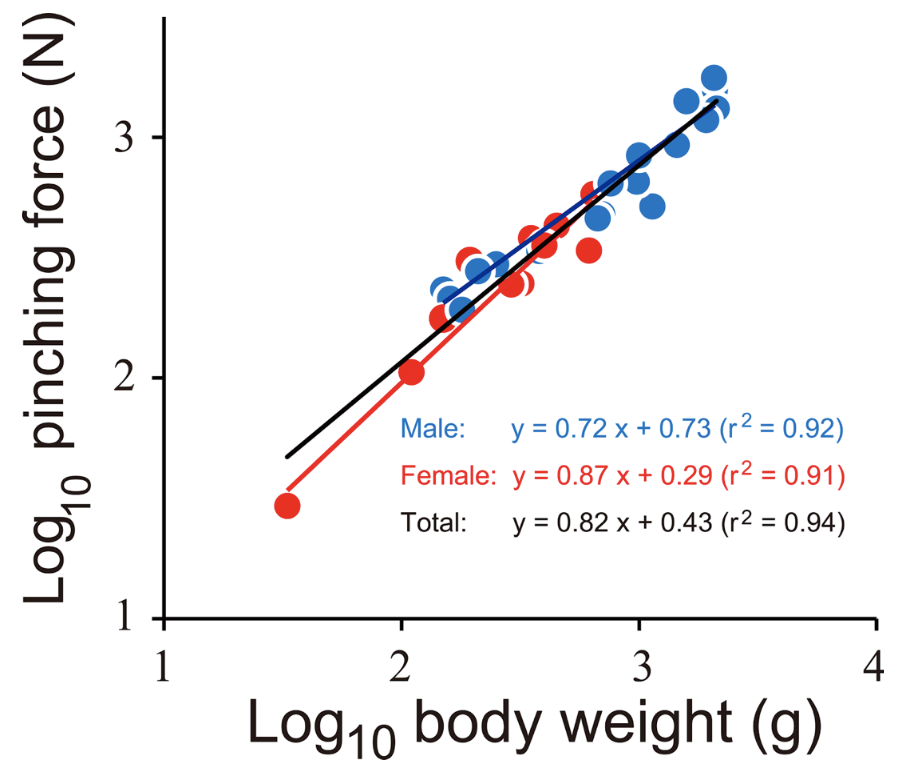
\end{equation}Figure 14 displays the log-log graph of the body weight in grams and the pinching force in Newtons. This is the case where the slope or the scaling factor for pinching force and BW of both sexes was found to be 0.82, and the y-intercept was found to be 0.43. Therefore, the function relating the BW to the pinching force would be y = 0.43x0.82. The r2 value on the graph represents how close to a straight line, or a linear relationship, the plot is based on how close the value is to 1. In this case, the r2 value is 0.94, which is very close to 1. Therefore this graph demonstrates a good linear relationship. As a = 0.82, which is greater than zero but less than one, the pinching force (attribute y) increases with body weight, but at a slower rate than that of proportionality.

Fig. 14 The relationship between pinching force and body weight of the coconut crabs. Blue and red indicate male and female, respectively. The black line is a regression line using the combined data of both sexes (Oka et al., 2016).
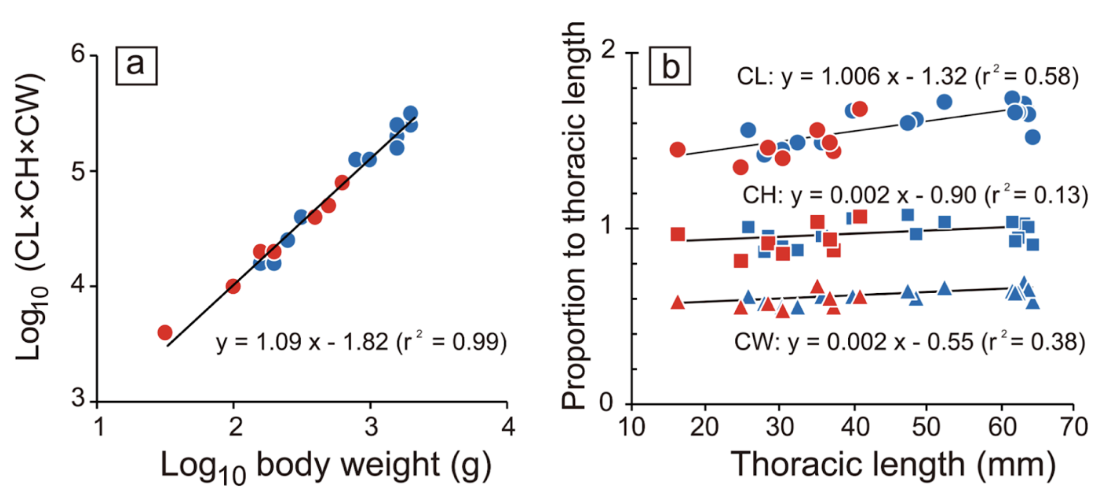
CL calculates the claw-mass index (claw length) times CH (claw height) times CW (claw width), all measured to the nearest 0.1 mm. Figure 15(a) represents the log-log graph of the claw mass index and body weight. This graph of experimental data provides a mathematical relationship between body weight and the claw mass index represented by y = 1.09x – 1.82 (r2 = 0.99). This equation reveals that the allometric scaling factor between the body weight of the coconut crab and its claw mass index is 1.09. This means that the claw mass index increases out of proportion to body weight or that the claw mass index is relatively more extensive for coconut crabs with more significant body weights. By utilizing all the data, one can infer that if coconut crabs with larger body weights have a larger claw mass index, and the pinching force varies in proportion to body weight, then the pinching force must also increase proportionally to claw mass index.
Figure 15(b) demonstrates the relationship between the overall size of the coconut crab and its chelae. Thoracic length is a measurement of the arthropod’s thorax, which is between the head and the abdomen. This is used to compare the size of different coconut crabs. This graph shows a relatively proportional relationship between the size of the coconut crab (or its thoracic length) and its claw length, as the slope of the best-fit line, which represents this relationship, is 1.006 (Oka et al., 2016).

Fig. 15 The relationship between (a) body weight and the index of claw mass, multiplied by claw length (CL), claw height (CH), and claw width, and (b) the thoracic length and each claw size measurement (circle: CL, square: CH, triangle: CW). Blue and red indicate male and female, respectively. Black lines are regression lines based on the combined data of both sexes (Oka et al., 2016).
Game Theory and Contest Assessment Strategies
Overview of Contest Assessment Strategies
In an environment with finite resources, competition drives agonistic behavior resulting in unequal distribution of resources (Darwin, 1859). This agonistic behavior of competitive species impacts the fitness of individuals and drives the natural and sexual selection of the species (Andersson, 1994; Darwin, 1859). Asymmetries in the competitive (fighting) abilities of combatants are frequently referred to as resource holding potential (RHP) (Parker, 1974). In analyzing the outcomes of animal conflicts, several game-theoretic models have been proposed. These models simulate the results of different contest assessment strategies, which can be broadly differentiated into three distinct strategies, distinguished by the level of combatant information considered.
The first strategy is pure-self assessment. This simulation is interpreted as a competitor entering a battle with only an understanding of their fighting ability. As such, accumulated contest costs result from the contestant’s persistence in accordance with their RHP. The war of attrition without assessment (WOA-WA) and energetic war of attrition (E-WOA) models presented by Mesterton-Gibbon (1996) and Payne and Pagel (1996, 1997), respectively, are two strategies that follow the self-assessment methodology.
The alternative contest assessment strategy is mutual assessment. In mutual-assessment games, competitors acquire information about the fighting ability of a rival and compare this to their fighting ability. Said comparison is interpreted as the relative difference in RHP that determines the contest duration and costs. Mutual assessment games are most modeled using the sequential assessment model (SAM) and asymmetric war of attrition (AWOA) model (Enquist & Leimar, 1983; Hammerstein & Parker, 1982; Parker & Rubenstein, 1981).
Another strategy to consider is the cumulative assessment model (CAM) (Payne, 1998). Like pure self-assessment, CAM considers the individual’s fighting ability to determine the contest outcome. Additionally, CAM also factors in the costs accumulated from the opponent’s actions. The decision to retreat in the CAM model is influenced by both the individual and the rival RHP with weaker rivals able to endure lesser contest costs while the competitors with higher fighting ability are capable of inflicting costs at a greater frequency.
As several crab species exhibit competitive behavior, game theory has been utilized to model the competitive strategies of crab conflicts. To do so, fighting ability (RHP) is associated with factors including body and chelae (pincers) size, with more significant armaments indicating greater RHP. In empirical studies, it is suggested that there is a negative relationship between RHP difference and contest duration (Smallegange et al., 2007). This result corroborates the expectations of game theory models, which assume that combatants closer in fighting ability are willing to endure greater contest costs to secure a resource (mates, territory, food, etc.) (Taylor & Elwood, 2003). Furthermore, it is shown that there is a negative association between winner RHP and contest costs, suggesting that the agonistic behavior of crabs is best modeled using mutual assessment and cumulative assessment strategies (Camerlink et al., 2017; Palaoro et al., 2014; Smallegange et al., 2007).
Game Theoretic Model of Exaggerated Armament Evolution
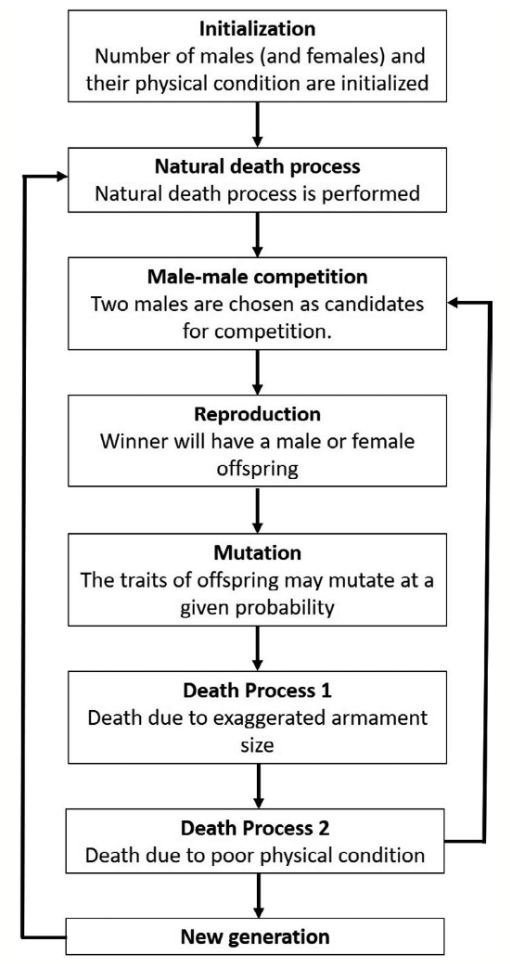
Although game theory has modeled the behavior of the combative lifestyle of crustaceans extensively (Camerlink et al., 2017), few studies have extrapolated further to determine the influence of game theory in simulating species evolution (Areja-Gavina et al., 2021). Using the mutual assessment strategy, the evolution of exaggerated armaments can be simulated using a game-theoretic sexual selection-based model to analyze the effects of selective and developmental forces in the male-male competition. (Fig. 16) (Areja-Gavina et al., 2021).

Fig. 16 Schematic diagram of species evolution process (Areja-Gavina et al., 2021).
Armament-wielding creatures, such as the fiddler crab, have two choices before participating in a contest. They can assess their fighting ability and determine if it is appropriate for them to partake in a contest with a rival or opt not to engage and better preserve their armaments. To estimate fighting ability, several factors must be considered. The first is simply the size of the armament itself. Individuals wielding larger armaments are shown to be at an advantage in competitions and thus are regarded to have higher fighting ability (Lincoln, 1994). Additionally, competitors with similar body sizes but differing armament sizes will result in a larger armament yielding greater fighting ability (Arnott & Elwood, 2009). However, the fighting ability of an individual isn’t solely based on the armament’s stature as the physical condition of a competitor must also be considered. Thus, the function for fighting ability can be modeled as shown in Equation (I) (Areja-Gavina et al., 2021).
\begin{equation}\tag{I}
f_i(j+1)=a_t\times b^k\times\frac{f_i(j)-cost}{100}
\end{equation}
Equation (I) is a recursive function where fi (j+1) is the fighting ability of an individual after a contest, at is the armament size, bk is the body size, fi (j)is the fighting ability prior to a contest, and cost is the resulting contest cost inflicted to the individual. To study the evolutionary effects of the conflict, the sexual selection and inheritance of features must also be considered. Thus, the contributions from each generation of successful contests and mating to the offspring traits must be considered and are modeled in Equation (II), where P1x and P2y are the initial contribution of the male and female traits to the offspring (Areja-Gavina et al., 2021). Similarly, Equation (II) considers the ratio of armament size to body size (art) using Equation (II) (Areja-Gavina et al., 2021).
\begin{equation}\tag{II}
a_t=b^k(P_1x+P_2y)
\end{equation}
\begin{equation}\tag{III}
a_{rt}=\frac{a_t}{b_k}=(P_1x+P_2y)
\end{equation}Lastly, the mortality of the individual must also be considered. Although sexual selection encourages the proliferation of exaggerated armaments, armament size is limited by the energetic and physical costs of an impractical armament. In other words, the size of the armament is also limited by natural selection. In Equation (4), the mortality of an armament m(art) is determined using the armament ratio, the value of art for which m(art) equals one (β), and a chosen exponent, α (Areja-Gavina et al., 2021). If the size of the armament is similar to or less than the body size, the mortality rate is considered to be such that natural selection does not determine the survival of the individual. However, for armaments that are larger than the body, natural selection contributes a mortality factor to the survival of the individual.
\begin{equation}\tag{IV}
m(a_{rt})=\{0,a_{rt}\le1\frac{1}{(\beta-1)^\alpha}(a_{rt}-1)^\alpha,a_{rt}>1\}
\end{equation}
Contests between the competitors are determined using the ratio between competitor armament sizes. Additionally, a threshold for armament size ratio is set to determine if the contest will involve physical competition. For armament ratios between competing individuals that exceed the threshold, the individual with the larger armament is considered to win by default indicating no physical competition. In the case that the competing ratio is below the threshold ratio, the contest proceeds with the individual possessing greater fitness as the victor (Areja-Gavina et al., 2021).
Effect of Allometry, Costs, Armament Ratio, and Mortality on Armament Evolution
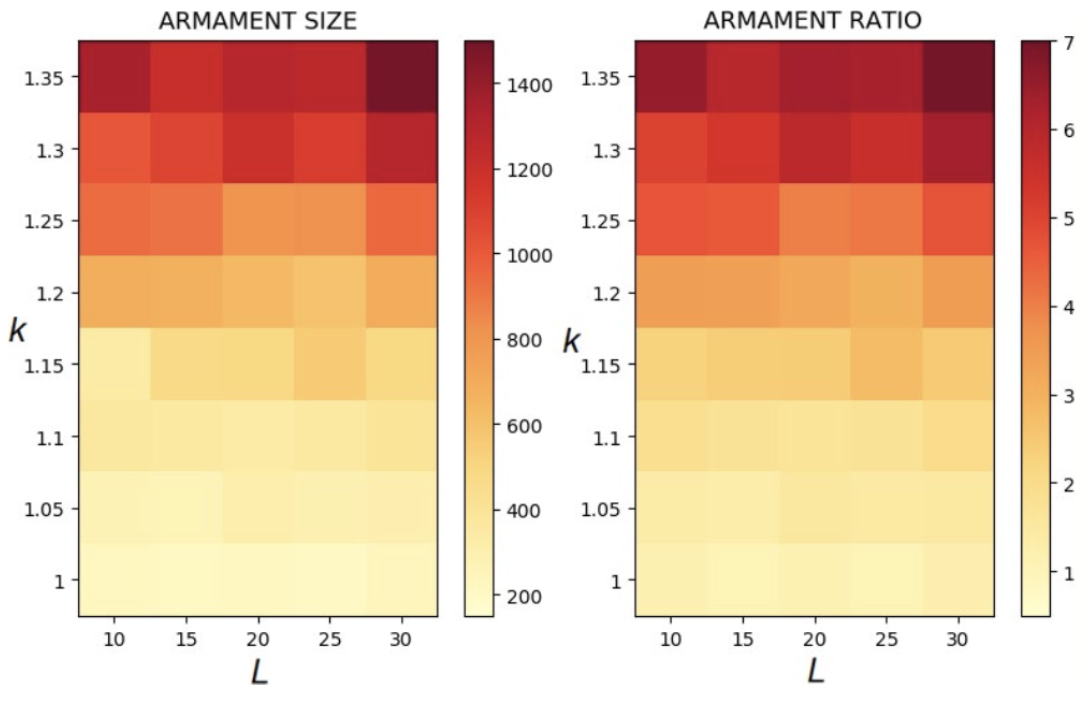
Through the use of the game theory, sexual selection-based model of armament evolution as done by Areja-Gavina et al. (2021), it is shown that many factors have roles in the evolutionary rate of armament size exaggeration. The most profound of which is allometry, as demonstrated in Figure 17. Figure 17 depicts three plots for three distinct allometric slopes. In brief, the allometric slope, k, determines the scaling change of armament size to the size of an individual’s body with higher allometric slopes indicating a “faster” rate of change of the size of armament to the body. Given this, it is expected that for higher allometric slopes, the rate of exaggerated evolution of male armaments is higher. This expectation is corroborated in Figure 17, with plots representing higher allometric slopes yielding significantly greater growth in armament size and armament size-to-body ratio (Areja-Gavina et al., 2021). Likewise, the heatmap in Figure 18 further shows that allometric slope is a significant factor in the rate of evolution and additionally suggests that the cost to the loser of a constant has little to no effect on the armament size/ratio evolution (Areja-Gavina et al., 2021). This result aligns with the empirical findings of Tidière et al. (2017), concluding that strong allometric relationship results in armament size growth, regardless of the damage inflicted by the winner to the loser.
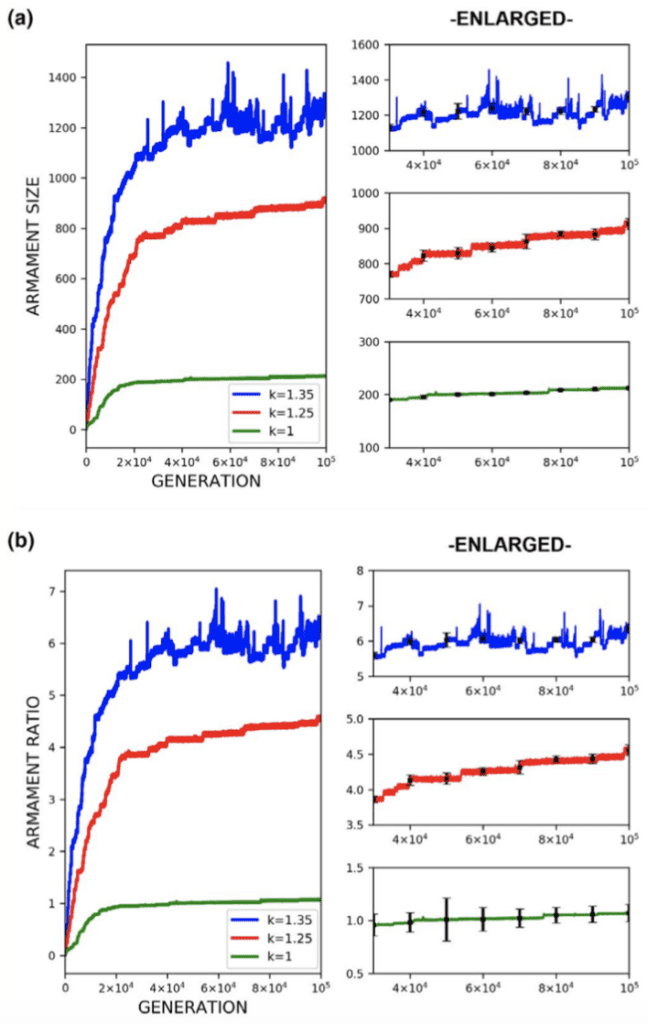
Fig. 17 (a) Plots of armament size versus generation for 3 different allometric slopes. (b) Plots of armament to body size ratio versus generation for 3 different allometric slopes. Plots (a) and (b) indicate that increased stronger allometric relationship yields a faster rate of exaggerated armament evolution (Areja-Gavina et al., 2021).

Fig. 18 Heat map of armament size and armament-to-body size ratio with respect to allometric slope and contest cost to the loser. Allometric relationship strength appears to have a positive relationship with armament size/ratio, while cost to loser has little to no association with armament size/ratio (Areja-Gavina et al., 2021).
Another important factor in augmenting the evolution rate is contest costs. Although Figure 18 suggests little to no association with the contest cost to the losing individual, there is the possibility of the cost to the winner influencing the evolution of the armament. In Figure 19, plots for increasing competition costs to the victor are shown (ratio of cost to winner and loser remaining constant). The slight advancement in armament size and ratio with increasing competition costs suggests that increasing the overall cost of competition encourages evolution to progress more rapidly. However, it should be noted that this phenomenon only occurs at higher allometric slopes and suggests that greater competition costs force individuals with low fighting ability to be replaced by stronger individuals, a process which is only evident at greater allometric slopes (Areja-Gavina et al., 2021).

Fig. 19 (a) Plots of armament size versus generation for 3 different contest costs. (b) Plots of armament to body size ratio versus generation for 3 different contest costs. For all contest costs, the ratio of cost-to-winner (W) to cost-to-loser (L) remains constant. Plots (a) and (b) suggest that increased contests cost encourages faster evolution of exaggerated armaments (Areja-Gavina et al., 2021).
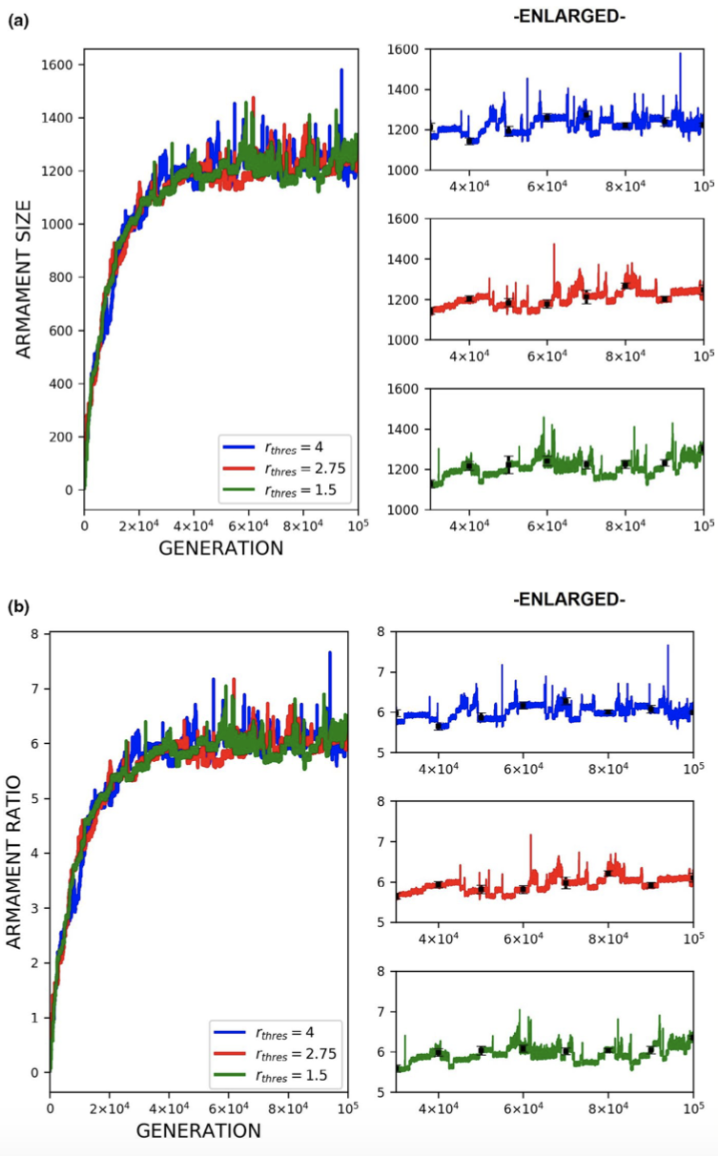
Another factor that was analyzed was the varying competitor armament size threshold. In Figure 20, three distinct thresholds were simulated producing three armament evolution plots for armament size and ratio. The lack of a significant distinction between the three threshold values indicates the threshold for which a combatant is decided to win by default has little effect on armament evolution. This result is rather unsurprising since, regardless of the threshold value, there will always be a victor to mate (Areja-Gavina et al., 2021). Another interesting observation from Figure 20 is the notable oscillation of the plots in the enlarged view suggesting that the sexual-selection-based evolution may be limited by mortality/natural selection (Areja-Gavina et al., 2021).
The effect of mortality is exemplified in Figure 21, depicting the effect of altering the rate of mortality on armament ratio progression. Equation (IV), the mortality describing function, dictates that for increasing values of alpha, the mortality rate is reduced. From the plots in Figure 21, increasing the alpha value (decreasing mortality rate), is associated with increased development of armament size as would be expected (Areja-Gavina et al., 2021). Likewise, the asymptotic behavior of the plots suggests the termination of evolution with increasing mortality rate, a result which is consistent with empirical findings of (Ditchkoff et al., 2001).
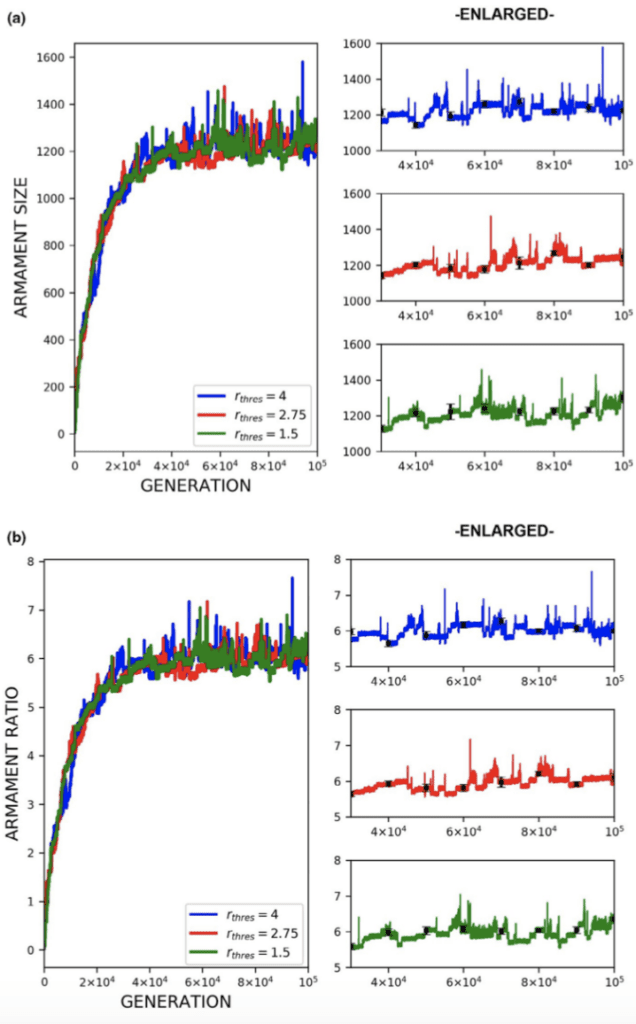
Fig. 20 (a) Plots of armament size versus generation for 3 different competitor armament ratio thresholds (b) Plots of armament to body size ratio versus generation for 3 different competitor armament ratio thresholds. Plots (a) and (b) suggest that there is little to no relationship between the ratio of armament sizes between competitors and the rate of armament evolution (Areja-Gavina et al., 2021).
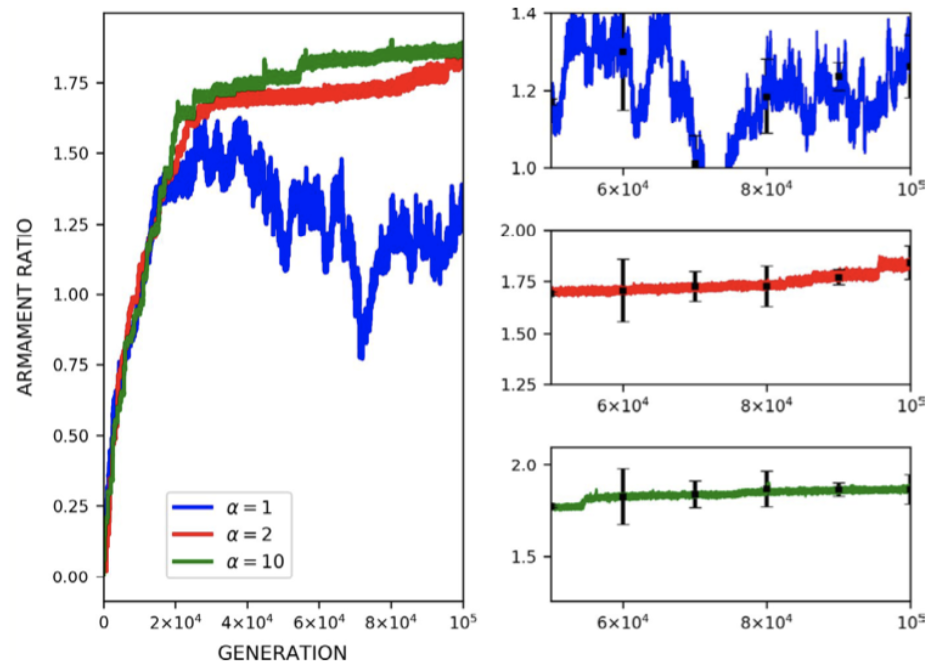
Fig. 21 (a) Plots of armament size versus generation for levels of mortality rates. (b) Plots of armament to body size ratio versus generation for 3 levels of mortality rates. Higher alpha indicates a lower mortality rate. As expected, plots (a) and (b) suggest that an increased lower mortality rate allows for faster armament evolution (Areja-Gavina et al., 2021).
Conclusion
In the analysis of the allometry and mathematical relationships formed by the pincer and pincer-wielding species, it is clear that the pincer is an evolutionary wonder. Depending on how the pincer is used, the morphology of crab pincers varies greatly. Although pincers appear to have a relatively simple design at first glance, their functional characteristics show various intricate details that add to their usefulness for various animals. Understanding how the size of the chelae changes in proportion to the size of the arthropod is vital in analyzing the morphology differentiating pincer-wielding species. For example, in the male fiddler crab, the chelae size is exaggerated with respect to the size of its body. There are also specific forms of allometry used to analyze species in different ways such as shape allometry, which is used to show which species have longer or shorter chelae in the evolutionary context. Modeling the agonistic behavior of species spanning several generations through game-theoretic sexual selection-based models predicts the strong positive effect of allometry on the evolution of exaggerated armaments. Additionally, factors including contest costs, and mortality (natural selection) are demonstrated to accelerate and limit armament development, respectively. These forms of mathematical modeling and analysis give more insights into the evolution of these species and therefore are incredibly useful in applying characteristics of those tools to modern-day innovation.
References
Andersson, M. (1994). Sexual Selection. Prince University Press.
Areja-Gavina, M. K. D., Torres, M. C., Gamilla, G. B., Sakaguchi, T., Ito, H., Rabajante, J. F., Tubay, J. M., Yoshimura, J., & Morita, S. (2021). Exaggerated evolution of male armaments via male–male competition [Article]. Ecology and Evolution, 11(11), 6977-6992. https://doi.org/10.1002/ece3.7546
Arnott, G., & Elwood, R. W. (2009). Assessment of fighting ability in animal contests [Review]. Animal Behaviour, 77(5), 991-1004. https://doi.org/10.1016/j.anbehav.2009.02.010
Ashraf, M. A., & Sarfraz, M. (2016). Biology and evolution of life science [Editorial]. Saudi Journal of Biological Sciences, 23(1), S1-S5. https://doi.org/10.1016/j.sjbs.2015.11.012
Camerlink, I., Turner, S. P., Farish, M., & Arnott, G. (2017). The influence of experience on contest assessment strategies [Article]. Scientific Reports, 7(1), Article 14492. https://doi.org/10.1038/s41598-017-15144-8
Chappell, R. (1989). Fitting bent lines to data, with applications to allometry [Article]. Journal of Theoretical Biology, 138(2), 235-256. https://doi.org/10.1016/S0022-5193(89)80141-9
Crane, J. (2015). Fiddler crabs of the world: Ocypididae: Genus Uca [Book]. https://www.scopus.com/inward/record.uri?eid=2-s2.0-85023158340&partnerID=40&md5=f933df3204caa71a404fd5af29c5a57a
Darwin, C. (1859). On the Origin of Species by Means of Natural Selection. John Murray.
Ditchkoff, S. S., Welch, E. R., Lochmiller, R. L., Masters, R. E., & Starry, W. R. (2001). Age-Specific Causes of Mortality among Male White-Tailed Deer Support Mate-Competition Theory. The Journal of Wildlife Management, 65(3), 552-559. https://doi.org/10.2307/3803108
Elner, R. W., & Campbell, A. (1981). Force, function and mechanical advantage in the chelae of the American lobster Homarus americanus (Decapoda: Crustacea) [Article]. Journal of Zoology, 193(2), 269-286. https://doi.org/10.1111/j.1469-7998.1981.tb03444.x
Enquist, M., & Leimar, O. (1983). Evolution of fighting behaviour: Decision rules and assessment of relative strength [Article]. Journal of Theoretical Biology, 102(3), 387-410. https://doi.org/10.1016/0022-5193(83)90376-4
Garland, T. (1983). The relation between maximal running speed and body mass in terrestrial mammals [Article]. Journal of Zoology, 199(2), 157-170. https://doi.org/10.1111/j.1469-7998.1983.tb02087.x
Gibbings, J. C. (2011). Dimensional Analysis (1 ed.). Springer London. https://doi.org/https://doi.org/10.1007/978-1-84996-317-6
Hammerstein, P., & Parker, G. A. (1982). The asymmetric war of attrition [Article]. Journal of Theoretical Biology, 96(4), 647-682. https://doi.org/10.1016/0022-5193(82)90235-1
Huxley, J. S. (1925). Constant differential growth-ratios and their significance [2] [Letter]. Nature, 114(2877), 895-896. https://doi.org/10.1038/114895a0
Huxley, J. S., & Teissier, G. (1936). Terminology of relative growth [6] [Letter]. Nature, 137(3471), 780-781. https://doi.org/10.1038/137780b0
Kerkhoff, A. J., & Enquist, B. J. (2009). Multiplicative by nature: Why logarithmic transformation is necessary in allometry [Letter]. Journal of Theoretical Biology, 257(3), 519-521. https://doi.org/10.1016/j.jtbi.2008.12.026
Klingenberg, C. P. (2015). Analyzing fluctuating asymmetry with geometric morphometrics: Concepts, methods, and applications [Review]. Symmetry, 7(2), 843-934. https://doi.org/10.3390/sym7020843
Klingenberg, C. P. (2016). Size, shape, and form: concepts of allometry in geometric morphometrics [Review]. Development Genes and Evolution, 226(3), 113-137. https://doi.org/10.1007/s00427-016-0539-2
Kruska, D. C. T. (2005). On the evolutionary significance of encephalization in some eutherian mammals: Effects of adaptive radiation, domestication, and feralization [Review]. Brain, Behavior and Evolution, 65(2), 73-108. https://doi.org/10.1159/000082979
Levinton, J. S., & Allen, B. J. (2005). The paradox of the weakening combatant: Trade-off between closing force and gripping speed in a sexually selected combat structure [Article]. Functional Ecology, 19(1), 159-165. https://doi.org/10.1111/j.0269-8463.2005.00968.x
Lin, W., Liu, P., Li, S., Tian, J., Cai, W., Zhang, X., Peng, J., Miao, C., Zhang, H., Gu, P., Wang, Z., Zhang, Z., & Luo, T. (2021). Multi-scale design of the chela of the hermit crab Coenobita brevimanus [Article]. Acta Biomaterialia, 127, 229-241. https://doi.org/10.1016/j.actbio.2021.04.012
Lincoln, G. A. (1994). Teeth, horns and antlers: The weapons of sex. The Differences between the Sexes, 131-158.
Mesterton-Gibbons, M., Marden, J. H., & Dugatkin, L. A. (1996). On wars of attrition without assessment [Article]. Journal of Theoretical Biology, 181(1), 65-83. https://doi.org/10.1006/jtbi.1996.0115
O’Hara, R. B., & Kotze, D. J. (2010). Do not log-transform count data. Methods in Ecology and Evolution, 1(2), 118-122. https://doi.org/https://doi.org/10.1111/j.2041-210X.2010.00021.x
Oka, S. I., Tomita, T., & Miyamoto, K. (2016). A mighty claw: Pinching force of the coconut crab, the largest terrestrial crustacean [Article]. PLoS ONE, 11(11), Article e0166108. https://doi.org/10.1371/journal.pone.0166108
Palaoro, A. V., Dalosto, M. M., Costa, J. R., & Santos, S. (2014). Freshwater decapod (Aegla longirostri) uses a mixed assessment strategy to resolve contests. Animal Behaviour, 95, 71-79. https://doi.org/https://doi.org/10.1016/j.anbehav.2014.06.014
Parker, G. A. (1974). Assessment strategy and the evolution of fighting behaviour [Article]. Journal of Theoretical Biology, 47(1), 223-243. https://doi.org/10.1016/0022-5193(74)90111-8
Parker, G. A., & Rubenstein, D. I. (1981). Role assessment, reserve strategy, and acquisition of information in asymmetric animal conflicts [Article]. Animal Behaviour, 29(1), 221-240. https://doi.org/10.1016/S0003-3472(81)80170-4
Payne, R. J. H. (1998). Gradually escalating fights and displays: The cumulative assessment model [Article]. Animal Behaviour, 56(3), 651-662. https://doi.org/10.1006/anbe.1998.0835
Payne, R. J. H., & Pagel, M. (1996). Escalation and time costs in displays of endurance [Article]. Journal of Theoretical Biology, 183(2), 185-193. https://doi.org/10.1006/jtbi.1996.0212
Payne, R. J. H., & Pagel, M. (1997). Why do animals repeat displays? [Article]. Animal Behaviour, 54(1), 109-119. https://doi.org/10.1006/anbe.1996.0391
Reshmi, R., & Bijukumar, A. (2010). First report of the hermit crabs Coenobita brevimanus and Coenobita rugosus (Crustacea: Decapoda: Anomura) from the Indian coast. Marine Biodiversity Records, 3, e121, Article e121. https://doi.org/10.1017/S1755267210001089
Rohlf, F. J. B., F. L. (1990). Proceedings of the Michigan Morphometrics Workshop. University of Michigan Museum of Zoology.
Rosenberg, M. S. (2002). Fiddler crab claw shape variation: A geometric morphometric analysis across the genus Uca (Crustacea: Brachyura: Ocypodidae) [Article]. Biological Journal of the Linnean Society, 75(2), 147-162. https://doi.org/10.1046/j.1095-8312.2002.00012.x
Ross, A. (2004). Procrustes Analysis.
Shingleton, A. W. (2010). Allometry: The Study of Biological Scaling. Nature Education, 3(10), 2.
Smallegange, I. M., Sabelis, M. W., & van der Meer, J. (2007). Assessment games in shore crab fights [Article]. Journal of Experimental Marine Biology and Ecology, 351(1-2), 255-266. https://doi.org/10.1016/j.jembe.2007.07.004
Taylor, G. M. (2000). Maximum force production: Why are crabs so strong? [Article]. Proceedings of the Royal Society B: Biological Sciences, 267(1451), 1475-1480. https://doi.org/10.1098/rspb.2000.1167
Taylor, P. W., & Elwood, R. W. (2003). The mismeasure of animal contests [Article]. Animal Behaviour, 65(6), 1195-1202. https://doi.org/10.1006/anbe.2003.2169
The Biology Project, B. (2005). Allometry. Department of Biochemistry and Molecular Biophysics, The University of Arizona.
Tidière, M., Lemaître, J. F., Pélabon, C., Gimenez, O., & Gaillard, J. M. (2017). Evolutionary allometry reveals a shift in selection pressure on male horn size. Journal of Evolutionary Biology, 30(10), 1826-1835. https://doi.org/10.1111/jeb.13142