


Abstract
Hydrae present interesting physical properties, chemical properties and finally, mathematical properties. This organism may not be able to consciously make any computations, but that does not mean that mathematics cannot be used to model behaviors of this organism and gain a greater understanding of how it functions. The goal of this essay is to understand how Hydrae relate to mathematics and why this information is useful. The regeneration patterns of the organism will be explored, taking a look at the various factors involved in defining certain spatial patterns. We will explain how basal disk regeneration is uniquely adapted in comparison to the rest of the Hydra’s regeneration patterns and discuss models of regeneration which are reliant on mathematics and statistics. Additionally, we investigate Hydrae’s relationship with its microbiota and, using a mathematical model, determine how this holobiont assembled and developed as the Hydra polyp matures. Finally, using tools from topology, Hydra regeneration is reinvestigated from a biophysical perspective.
Introduction
Hydrae are a small aquatic organism which has been around for millions of years. This organism has many interesting properties which have spurred great academic interest. Notably, Hydrae are considered immortal and exhibit the extraordinary ability to regenerate, even from just pellets of dissociated cells. By studying the Hydra, we gain insights not only into its adaptive mechanisms, but also into broader phenomena observed in other organisms, potentially pertinent to human interests. Not only is mathematics a powerful tool which allows us to model the world as we see it, but the realm of theoretical mathematics has proven to be oftentimes unexpectedly influential in the practical domain, finding applications in diverse fields including biology. By modelling the Hydra and using concepts from “pure mathematics” to study it, we can get a grasp of how living systems work, and the layers of complexity that go into governing biological processes, even for what might be considered a basal organism. In this essay, we aim to present the current understanding of various compelling biological functions and behaviours exhibited by the Hydra using mathematical abstraction.
Regeneration Pattern Models
Turing Model
Due to the simplicity of Hydrae, the organisms are used as models for axis formation in higher organisms. The first breakthrough morphogenesis pattern formation was proposed by Turing in 1952 (Alan Mathison Turing, 1952). To determine the changes of state to consider, Turing believed four main points should be considered. The first being the changes of position and velocity as given by Newton’s laws of motion. The next being the stresses as given by the elasticities and motions, also taking into account the osmotic pressures as given from the chemical data and the chemical reactions. The last being the diffusion of chemical substances (Gierer, 2012). His model demonstrated that pattern formation can be accomplished through the interaction of two substances spreading at different rates (Alan Mathison Turing, 1952). From this, he created the model equations where Y is highly diffusible while X acts locally and t is time:


He demonstrated that in a homogeneous steady state that is unstable (X=1 and Y=1), a small local deviation from the steady state is sufficient to trigger the onset of pattern formation. These interactions were named ‘reaction-diffusion systems.’ However, this mechanism has its drawbacks with the most significant being that negative concentrations can occur since X molecules can disappear even when all X molecules are gone. Turing addressed this problem by ignoring the negative concentrations (Alan Mathison Turing, 1952). This problem is shown in the pattern formation model simulation in Fig. 1.
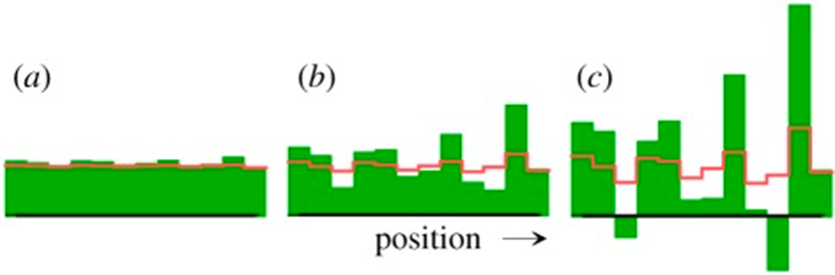
Fig. 1. Pattern formation simulation of Turing’s equations with (a) initial and (b, c) later distributions of regeneration patterns (Meinhardt, 2012).
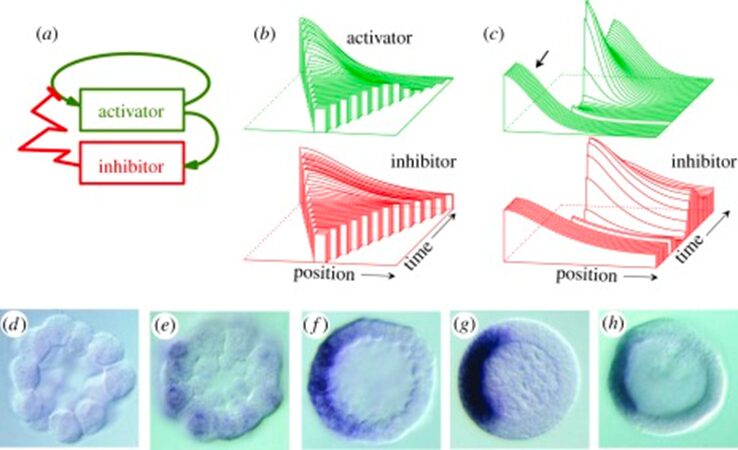
Although this model had issues, it was a fundamental discovery for the scientific community that patterns can be generated by interactions of molecules moving at different rates and was essential in understanding development and regeneration. To improve this model, researchers introduced the condition of self-enhancement and long-ranging inhibition for pattern formation. Thus, a model was published stating pattern formation is only possible if a local self-enhancing reaction is coupled with an antagonistic reaction of long range. The interaction between the activator a and the inhibitor b are shown in the following mechanism where t is time and x is the spatial coordinate (Meinhardt, 2012).


It is important to note that activator a has nonlinear positive feedback on its own production, which is slowed by the inhibitor b. The diffusion rates of a and b are Da and Db with removal rates being μa and μb. The source density ρ, describes the ability of cells to perform autocatalysis which is when the product of the reaction acts as a catalyst, aiding in the subsequent conversion of reactant to product. The simulation of the activator-inhibitor interaction is shown in Fig. 2. In Fig. 4b, illustrates when a growing chain of cells reaches a certain size, the random fluctuations initiate pattern formation. On the other hand, figure 4c, illustrates regeneration after the removal of the activated region where the inhibitor fades until a new activation is triggered (Meinhardt, 2012). However, several interactions were discovered exhibiting the basic function of autocatalytic activation and long-range inhibition.

Fig. 2. Pattern formation simulation of activator-inhibitor interaction (Meinhardt, 2012).
Receptor-based Model
Another model for pattern formation proposed was receptor-based with hysteresis. In this model, the longitudinal pattern is subdivided into a head, gastric region, budding zone, stalk, and a foot. The model assumes that the function of cells is determined by their location. Epithelial cells secrete ligands which diffuse locally within interstitial space and bind to free receptors on the cell surface (Marciniak-Czochra, 2006). The model consists of reaction-diffusion equations with zero-flux boundary conditions along with a system of ordinary differential equations (ODEs). Two experiments were performed to investigate the mechanisms regulating the dynamics of cell surface receptors and diffusing biochemical molecules and validate the model: cutting experiment and grafting experiment. As shown in Fig. 3, the cutting experiment demonstrated that after a transverse cut, both parts of the animal can regenerate and the positional cues for the function of the cells.
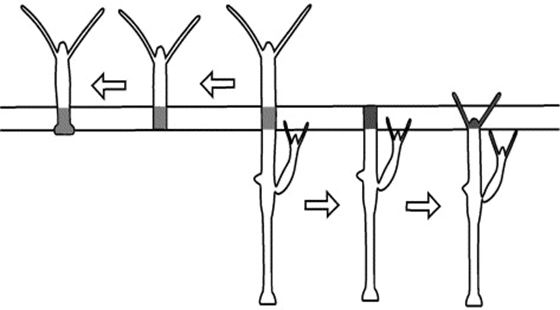
Fig. 3. Cutting experiment, function of cells depends on position along the body column (Marciniak-Czochra, 2006).
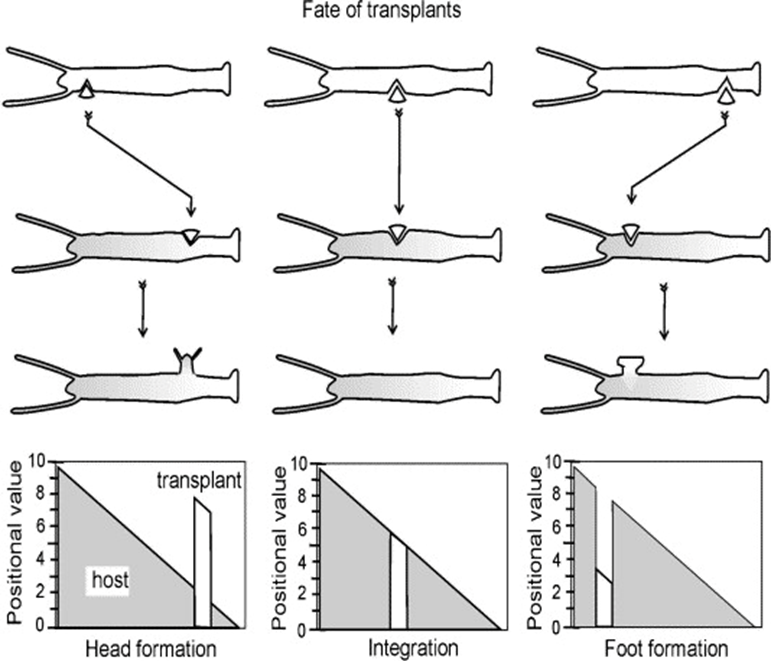
In the grafting experiment, transplantation of tissue from the body close to the head induces head formation while transplantation of the tissue from the position close to the foot results in foot formation (Marciniak-Czochra, 2006). This demonstrates that relative positional information values transplantation, shown in Fig. 4.

Fig. 4. Grafting experiment, pieces of tissue grafted from one organism to another with 3 shown outcomes (Marciniak-Czochra, 2006).
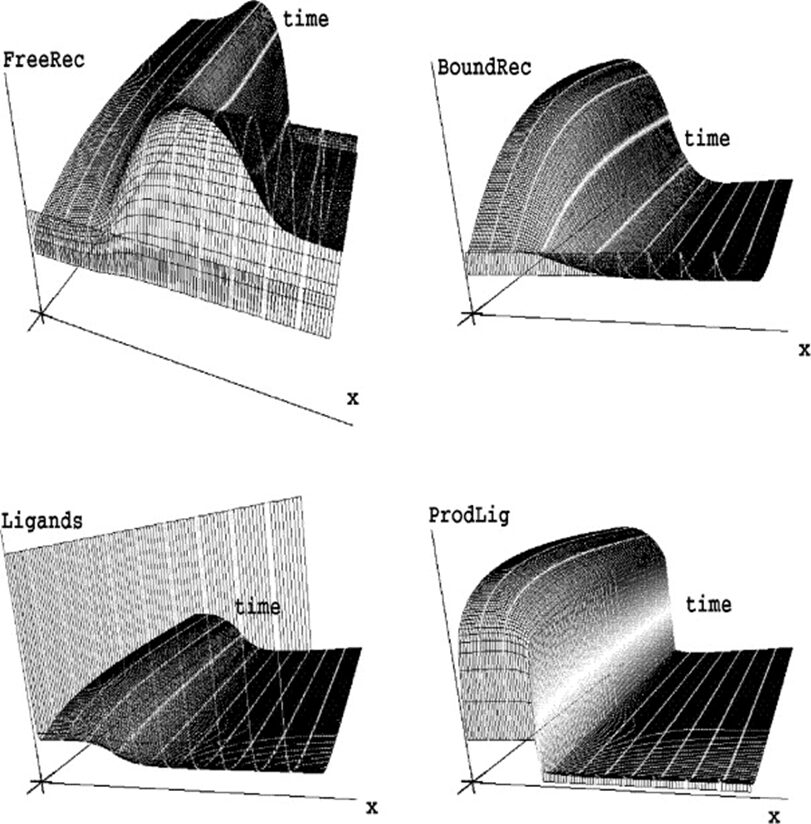
The proposed model describes receptor-ligand binding, taking into consideration the density of free receptors, bound receptors, and ligands as well as a second diffusible substance functioning as an enzyme. A one-dimensional epithelial sheet of length L is considered because it is assumed that the ligands and receptors are produced on the cell surface. The concentrations of free receptors, bound receptors, ligands, and enzyme densities by rf, rb, l and e, respectively. The zero-flux boundary conditions for l and e are represented. dl and de are diffusion coefficients for the ligands and the enzyme. The system was then rescaled on the domain [0, 1], dl was set to  and de to
  where γ =
  and d2 =
  . Rates of decay of free receptors, bound receptors, ligands, and enzymes are denoted by μf, μb, μl and μe, respectively. d is the rate of dissociation, b is the rate of binding of ligands and free receptors, be is the rate of binding of ligands and the enzyme. pr, pl, and pe denote production rates of new free receptors, ligands, and the enzyme (Marciniak-Czochra, 2006). However, the first model did not support the grafting experiment results. The results suggest the model should have a memory-based relation, which can be achieved by modeling hysteresis. In pattern formation, hysteresis often implies that the development or evolution of spatial patterns is influenced not only by the immediate environmental or internal conditions but also by the system’s prior states and the pathway it took to reach its current state. To model hysteretic dependence of plon l and pe on e, the kinetic functions were incorporated.


Shown in Fig. 5, simulations of the system following parameter set II were performed and it was determined that an increasing γ corresponds to an increase in the domain size or a decrease in the diffusion coefficient of the initial problem. The parameters were chosen to allow hysteretic dependence of pl on l. The model is able to successfully explain results of the grafting experiments since multiple spatially inhomogeneous solutions may coexist.
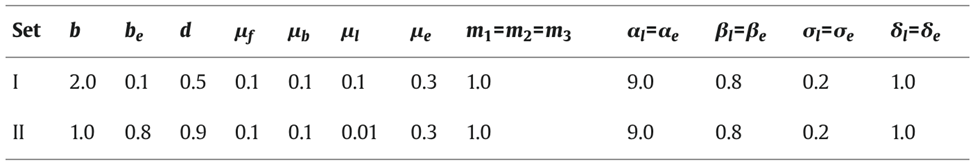

Fig. 5. Simulation of model equation following set of parameters II in table (Marciniak-Czochra, 2006).
Overall, there are two ways in which a system of initially identical cells can start to differentiate, both based on the idea that patterns are controlled by cell-surface receptors transmitting cell signals responsible for differentiation. In the Turing-type model, there is a critical number of cells dependent on the size of the domain. The spatially homogeneous attractor loses stability, leading to ‘spontaneous’ spatial patterning. In the hysteresis model there is a strong external inducing signal or forcing term, originating from a transplant of already differentiated cells, driving the system into a new spatially inhomogeneous state. This corresponds to large initial perturbation of the homogeneous steady state.
Basal Disk Regeneration
Hydra is capable of regeneration of cells throughout its entire body, however the regeneration in the basal disk region is one of the most important functions of the organism. This is because, as described in a paper on Hydra’s feedback inhibition, basal disk cells must be continuously regenerated to compensate for the cells lost during basal disk attachment (MacWilliams, Kafatos, & Bossert, 1970). There are cells lost due to the fact Hydra secretes secretory granules to attach itself to surfaces. We can be certain of this as there is always a footprint present on a surface after a Hydra detaches itself at the basal disk and substrate interface. Thus, the secreted granules are not recovered and recycled by the organism. Thus, there must be some negative feedback inhibition to not overproduce these cells. In some sense, the Hydra, or its body, must know how many basal disk cells are present, and produce them at a rate inversely proportional to the quantity already present. Though the Hydra definitely does not possess computing abilities which would allow it to understand any sort of complex mathematical equations, this group of researchers expects that the regeneration of basal disk cells can be somehow modelled mathematically. They have conducted tests to probe for greater insight on how the Hydra regulates this process.
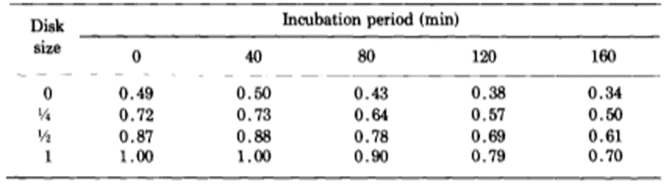
The researchers kept thousands of Hydrae in incubators and selected approximately 100 to test at a time. They hoped to understand the frequency of success and failures of regeneration of the basal disk. They would graft part of the Hydra’s peduncle, the region containing the basal disk, and separate it from the original Hydra. Then, they would match the removed fragment with a Hydra of similar size and graft the two segments of the Hydra together. The part cut off from the Hydra sometimes contained a basal disk, other times only a fragment of the disk, and sometimes no part of the disk at all, just other parts of the peduncle. Therefore, it would be important for some regeneration to take place for the Hydra to return to its usual state. Therefore, they observed the regeneration of the mish mash Hydrae. They found that the graft always regenerated a basal disk at its apical tip; however, the host would also sometimes regenerate a basal disk from the mid-peduncle that had not been removed. One basal disk regeneration was considered a success, whereas two basal disks being regenerated would be considered a failure. This is because the Hydra’s body in the wild usually regenerates with only one basal disk, and the creation of two would imply that the Hydra did not detect the presence of too many basal disk cells and its feedback inhibition did not successfully prevent the generation of a secondary disk. It would seem in this case, that there was no communication or signaling between the two regions regenerating the basal disks. Below is a table containing their results as a probability of success (Fig. 6).
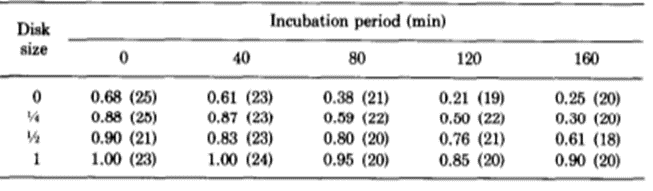
Fig. 6. Experimental probability of success as a function of incubation period and disk size (MacWilliams, Kafatos, & Bossert, 1970).
The team identified two variables that seemed to affect the success of Hydra basal disk regeneration, that is, the regeneration of a single basal disk after grafting. These two variables were incubation period and the size of the grafted region that was attached to the host, the disk size. While larger disk size seemed to have a positive effect on successful basal disk regeneration, longer incubation periods generally reduced the probability of success. Note that the 0 disk size does not mean that nothing was grafted to a Hydra, rather that the grafted area was part of the peduncle but did not already contain a disk. The team also noted that there was not any state between success and failure, the feedback inhibition was either on or off for the ensemble of the two regions. There were no situations where half of the basal disk from the host was regenerated and half from the graft was regenerated, for example. The researchers determined that the regenerating Hydrae can exist in three conditions, susceptible, incapable or nonsusceptible. The susceptible conditions means that the host is susceptible to a signal from the grafted segment and will produce a basal disk when the inhibition is off and not produce one when the signal is on. The probability of susceptibility will be found in the below table as a when incubation period is 0 and b,…, e during non-zero incubation periods. The incapable condition is when the host does not form a disk regardless of the signal from the basal disk. The probability of this condition will be a’,…, e’. Finally, the nonsusceptible condition is defined as when the host will regenerate a basal disk with no regard to the signal provided by the grafted segment. This condition can only be met if the previous two are not, therefore its probability must be 1- (a + a’),…, 1-(e + e’). Their model also considers the probability that the inhibitory signal from the basal disk graft is on, which is denoted as w, x, y, z for 0, ¼, ½ and 1 disk sizes, respectively. Therefore, the probability of observing inhibition of the basal disk regeneration from the host Hydra should be, for example, aw + a’. Only the first term contains the probability of the signal being on since only if the Hydra is in the susceptible state it will respond to the signalling from the peduncle graft. The second term is independent of the signalling, and despite accounting for non-ideal functioning of the Hydra, can still lead to a success in some specific circumstances. The inhibition of basal disk regeneration from the host should always lead to a successful trial, since the basal disk graft always regenerates a basal disk, regardless of any signalling that may be present from the host Hydra. Therefore, the table below (Fig. 7) should be a potential model for successful regeneration of a singular basal disk.
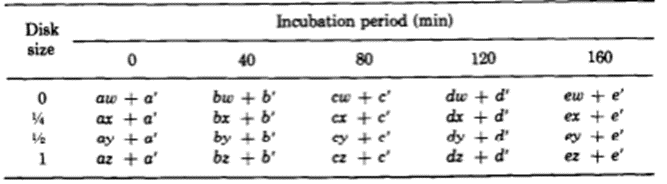
Fig. 7. A mathematical model for probability of successful regeneration dependent on disk size, incubation period and host Hydra state (MacWilliams, Kafatos, & Bossert, 1970).
The researchers estimated all of the parameters so as to best model their results. For these estimations, they used Rosenbrock’s algorithm, which should minimise the sum of squared differences between the model’s predictions and experimental data. The z parameter should be greatest of w,…, z since the host basal disk regeneration seemed to be most inhibited when disk size was 1. The algorithm also assumed that a = z and that the z should decrease to w. Parameter a should also be the greatest of a,…, e, decreasing in alphabetical order. The z parameter was set to 1 to give the algorithm sufficient conditions. Otherwise, the first term of every probability, such as aw, would have an infinite set of valid solutions as it would be the multiplication of two free parameters. The final table with the predictions from the mathematical model can be seen below (Fig. 8).

Fig. 8. Probability of successful basal disk regeneration as predicted by mathematical model (MacWilliams, Kafatos, & Bossert, 1970).
The researchers also developed a more complicated continuous model, which seemed to better model the probability of successful regeneration. This led them to believe that the feedback inhibition may not either be on or off, but rather alternate between on and off rapidly. The undifferentiated epidermal cells may have a response to the long-term average of these signals and regenerate or not regenerate a secondary basal disk based on this average. This implies that the Hydra does communicate through its body with quantitatively variable data, which is then condensed into qualitative data for the Hydra to act on. They extend their conclusions to wild Hydra, who likely have the same mechanism, where feedback inhibition correlates linearly with basal disk size and involves a transmission of qualitative data. They also determined that the basal disk is a source of inhibition and does not seem to be affected by the host Hydra.
The Hydra Holobiont
From its discovery, Hydrae were always considered a valuable organism for research, especially given its ability to regenerate. As such, for decades, the main area of research in Hydrae was centered around pattern formation and stem cell regulation. However, a simple proposition made by dermatologist Jens Schroder in the summer of 2000, that of using Hydra as a model to look into the biochemistry of epithelial defense, eventually led to a surprising revolution in the field of immunology, which emphasized the idea of a holobiont (Bosch & Miller, 2016). More precisely, a multicellular organism must be viewed in context of the biotic and abiotic environment surrounding it by looking at its association and interactions with other bacteria, fungi, viruses and various eukaryotes. Thus, animals are not homogenous entities, but rather metaorganisms with complex microbial communities that evolved together for millions of years and whose interactions can directly impact an organism’s health and development (Bosch & Miller, 2016).
Bacterial colonization in Hydra
In vertebrates and in invertebrates, microbial colonization by beneficial microorganisms influences the host’s metabolism, development, behavior, immune system and more. To better understand this crucial process in the Hydra holobiont, researchers used pyrosequencing of bacterial DNA to characterize the microbiota in the first 15 weeks of newly hatched Hydra Vulgaris polyps. Indeed, four clonal cultures were produced from the hatchlings and, every week, a polyp from each culture was used to determine the composition of its microbiota, with a total sample size of 36 polyps (Franzenburg et al., 2013). Using Chao1 metric to estimate bacterial species, it was shown that, immediately after hatching, the bacterial diversity was the highest with around 350 operational taxonomic units (OTUs) at 97% sequence similarity. Then, in all 4 replicates, diversity decreased for the next 2-3 weeks, reaching a local minimum of around 150 OTUs, and at the fourth week, increased to a peak of 200-300 OTUs, before decreasing again for the next 11 weeks at around 100 OTUs (Fig. 12). Consequently, the bacterial diversity in the Hydra holobiont declines as the organism develops and ages (Franzenburg et al., 2013). Then, comparing bacterial diversity with abundance demonstrated that the fluctuation in abundance did not depend on age nor diversity as neither, polyp 1, which had high abundance after hatching, nor polyp 2 with low abundance after hatching, showed similar correlation or trend in their graph (Fig. 9) (Franzenburg et al., 2013).
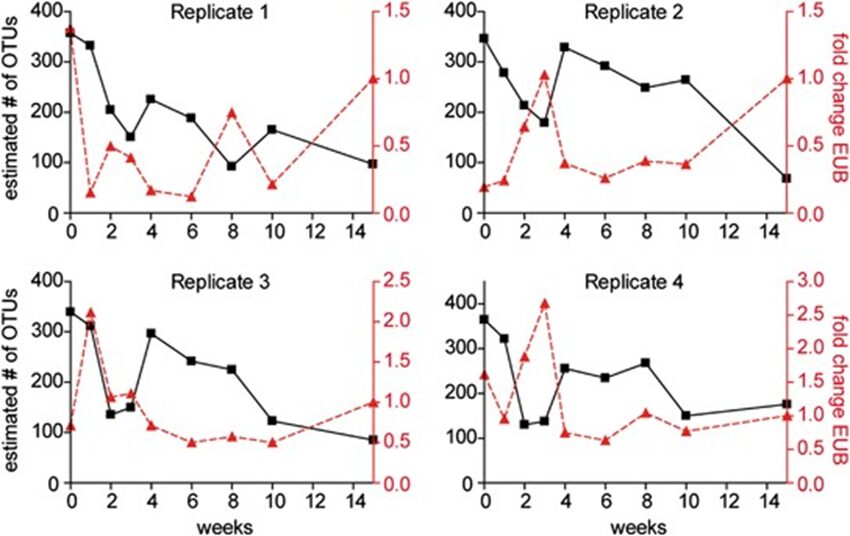
Fig. 9. Changes in bacterial diversity and abundance through time for the four clonal cultures. The estimated number of OTUs (97%sequence similarity, Chao1 metric) vs time after hatching (black line). The relative bacterial abundance per host cell (analyzed by quantitative PCR for the 16S gene, red line) (Franzenburg et al., 2013).
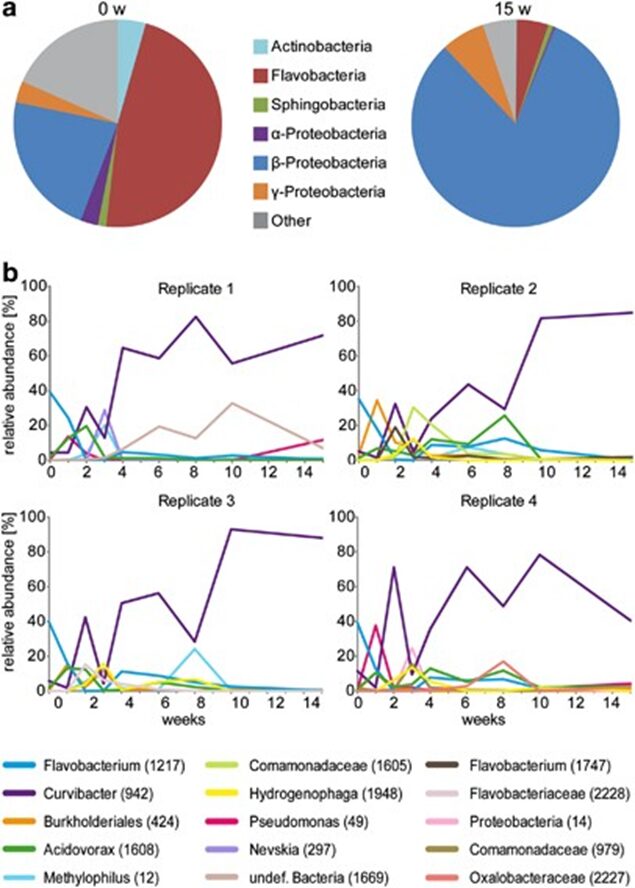
Researchers also identified the class of members of the bacterial community and their abundance as the polyp matures, which highlighted the significant difference between the bacterial composition in hatchlings compared to adults. In fact, the presence of gram-negative anaerobic bacteria of the Bacteroidetes (Ettinger, 2017) group, such as Flavobacteria and Sphingobacteria, was distinctively higher in newly hatched polyps than in mature polyps (Fig. 10a). In contrast, while the amount of Betaproteobacteria in young polyps was noticeable, their abundance significantly grew as the polyps developed and make up around 80% of total OTUs in mature polyps (Fig. 10a) (Franzenburg et al., 2013). Detailed graphs depicting the growth of bacterial species as a function of time in all four replicates reveal, similarly, a large amount of Flavobacterium (OTU 1217) with an appreciable amount of Curvibacter (OTU 942) in polyps right after hatching (Fig. 10b). Subsequently, the next three weeks of bacterial assembly demonstrated a rapid change in composition consisting of various species with, ultimately, Curvibacter dominating the mature holobiont starting from around the fourth week, causing a decrease in bacterial diversity (Franzenburg et al., 2013). Overall, however, researchers hypothesized that the fluctuation in the abundance of varying species can be explained by niches that the organism offered to bacterial colonizers, which led to the competition between bacteria in the first three weeks, with, in the end, Curvibacter coming on top and occupying most of the niches. This would explain the sharp decline in the presence of Flavobacterium as the host did not have a niche for it (Franzenburg et al., 2013).

Fig. 10. Changes in bacterial composition through time. (a) Pie diagram of the composition of the Hydra holobiont immediately and 15 weeks after hatching. (b) Relative abundance of bacterial OTUs through time (15 weeks). OTUs below 10% in every sample were not plotted. Note: Curvibacter (OTU 942) has a sharp increase at week 2, declines and finally becomes the dominant bacteria in adult Hydra (Franzenburg et al., 2013).

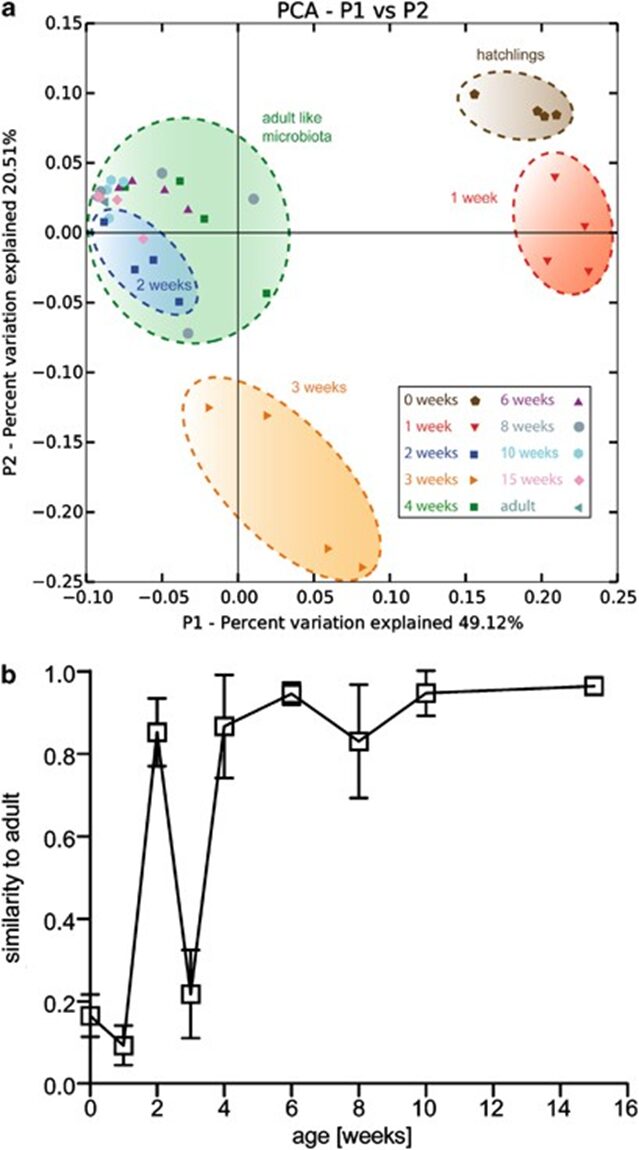
Fig. 11. Profiling of the assembly of bacterial communities through time. (a) Principal coordinate analysis of Pearson’s distances between Hydra bacterial clusters at week 0,1,2,3,4-15. The axis indicates the percent variation explained by the principal coordinate analysis. (b) Mean Pearson’s correlation between the microbiota OTU in each week compared with an adult profile from four independent adult polyps (clonal propagation for 1 year). Note: At week 2, the Pearson’s correlation peaks before dropping (Franzenburg et al., 2013).
Additionally, researchers performed a principal coordinate analysis to graphically show that distinct microbial communities formed clear clusters at different points in time (Franzenburg et al., 2013). Notably, the Hydra holobiont directly after hatching differs significantly from the one in week 1, 2 or 3 (Fig. 11a). However, after week 4, the holobiont is shown to have stabilized to that of a mature Hydra microbiota (Fig. 11a). Equally, the principal coordinate analysis also indicates that the bacterial community in week two closely resembles that of an adult hydra, which is supported by a high Pearson’s correlation represented by the peak in week two (Fig. 11a,b). Thus, the assembly of bacterial communities in Hydra polyps can be characterized by a general decrease in diversity with age, with high abundance of Flavobacterium initially and Curvibacter as the organism matures. A sharp increase in diversity at around week 4 can be associated with the fluctuating communities of various bacteria fighting for a niche, while the decrease in diversity around week two might be explained by the sudden transient similarity of the microbiota with that of adult polyps (Franzenburg et al., 2013).
Mathematical modeling of holobiont colonisation
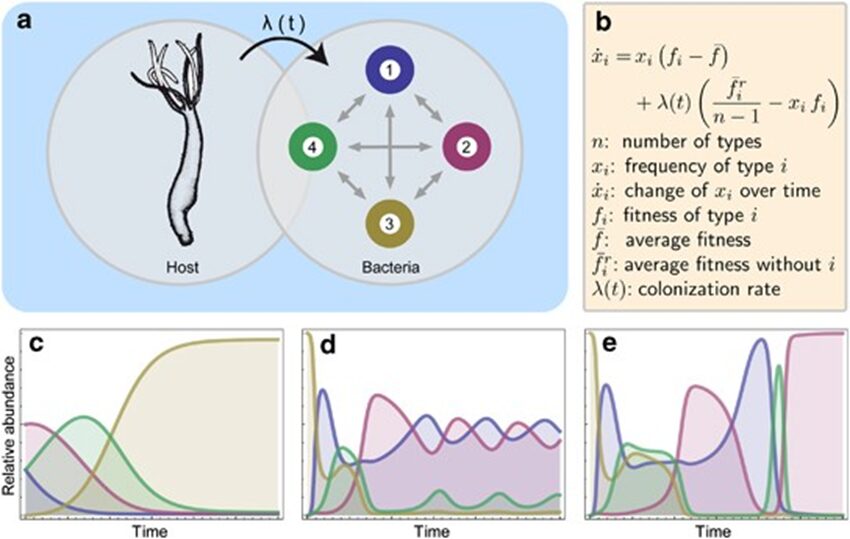
To better understand the rules and factors driving the development of the bacterial community in Hydra, researchers developed a mathematical model to mimic the conditions and events experimentally obtained. More precisely, the model is based on the replicator-colonizer approach which models the deterministic interaction between bacterial communities in a competitive environment through time (Fig. 12a,b) (Franzenburg et al., 2013). To simplify the enormous diversity and complexity of the Hydra holobiont, the model reduced the hundreds of microbial species to four manageable, distinct members and assumed that their interactions are pairwise only (Fig. 12a) (Franzenburg et al., 2013). From this, three main scenarios were analyzed (Fig. 12c-e).

Fig. 12. Replicator-colonizer mathematical model of bacterial colonization process in Hydra. (a) mathematical model with 4 bacterial members (n=4) interacting pairwise depending on their fitness and the colonization rate λ(t). (b) Basic dynamic replicator-colonizer equation. (c-e) Qualitative colonization patterns produced through the model. (c) Constant type-specific fitness values with colonization rate λ=0.02. (d) Abundance-dependent bacterial fitness with λ=0.02 creating a cyclic pattern. (e) Abundance-dependent bacterial fitness with colonization rate ( ) resulting in a cyclic pattern yielding a dominant bacterial type (Franzenburg et al., 2013).
The first one assumed constant type-specific fitness values, where the growth and colonization rate were constant, and the most competitive bacteria is the type with the highest growth rate (Fig. 12c). However, the resulting colonization pattern did not match the one found experimentally as the dominant bacteria does not undergo temporary decrease in abundance like Curvibacter doesaround week 3 and 8 (Fig. 10b, 12c) (Franzenburg et al., 2013). As a result, the second scenario portrayed an abundance-dependent bacterial fitness, where the most numerous bacteria were at a disadvantage and the least abundant one was at an advantage (Fig. 12d). This caused a sinusoidal oscillatory colonization pattern that replicated the decline in abundance observed previously, but it did not lead to a singular dominant bacterium colonizing most of the host (Fig. 10b, 12d) (Franzenburg et al., 2013). Therefore, the last scenario included the abundance-dependent bacterial fitness and a time-dependent, decaying exponential colonization rate,  , with a decay constant (τ) related to either the environment or the host (Fig. 15e). Finally, this successfully qualitatively reproduced the cyclic competition pattern with, in the end, a single stable dominant bacterium that is temporarily present in high numbers early during the assembly process, but then, declines before occupying most niches (Fig. 10b, 12e) (Franzenburg et al., 2013).
Consequently, given that this colonization pattern mimicked that of the experimental data, the assembly of microbial communities in Hydra polyps may be influenced by bacterial interactions based on abundance-dependent fitness and an environmentally or host-derived factor that modulates the colonization rate (Franzenburg et al., 2013). As such, using mathematical models, it is shown that Hydra evolved a fascinating design solution to the problem of regulating microbial communities. Indeed, by developing niches for certain bacteria and utilizing either an environmentally or host-derived factor influencing the colonization rate, Hydra polyps can selectively shape their microbiota in favor of a single dominant symbiotic bacterial species, while benefiting from the abundance-dependent fitness of bacterial interactions to maintain a minimum of diversity as they gradually mature.
Hydra Topology
Introduction to biotopology
Topology is the branch of mathematics concerned with the enduring properties of geometric objects through continuous deformations without tearing or passing through themselves. When applied to living systems, it is termed biotopology. For example, membrane systems in living cells can be studied as closed and orientable surfaces (having an empty boundary, unlike a piece of paper, and having two distinct sides, unlike a Möbius strip) (Jockusch & Dress, 2003). Closed and orientable surfaces include spheres (and the generalized spheroids) and tori (and the generalized toroids).
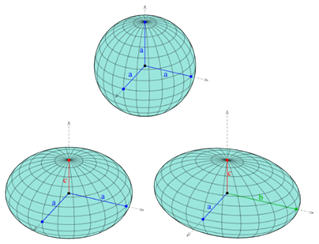
Fig. 13. A sphere is based on a circle (top), while a spheroid is based on ellipses (bottom).

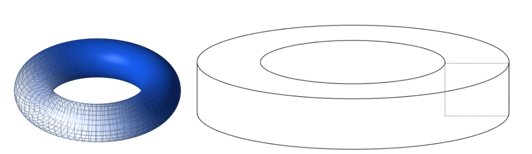
Fig. 14. A toroid is a surface of revolution with a hole in the middle. A torus is where the revolved figure is a circle (left) (Torus by Lucas Vieira). A toroid using a square is shown on the right (Toroid by Zoreks). A donut and a teacup are both toroids and are therefore topologically equivalent.
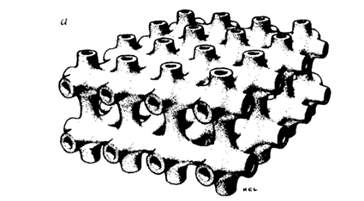
Fig. 15. Biomembranes generally form roughly spherical surfaces. However, biomembranes in specialized structures of plant cells called the prolamellar body can form multiple toroids (Lipowsky, 1991).
Mathematical topology is also used in studying epithelial cell sheets in multicellular animals. The body plan of a Hydra polyp is topologically a sphere. Its gastrulation involves the separation of cells from the outer layer of the spherical blastula into the inner space where a new cell layer is formed, resulting in two spheres one embedded within the other. When forming a mouth through dynamic opening, the two spheres fuse together (Jockusch & Dress, 2003).
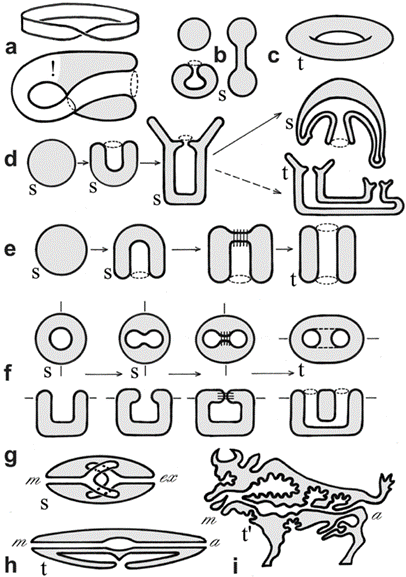
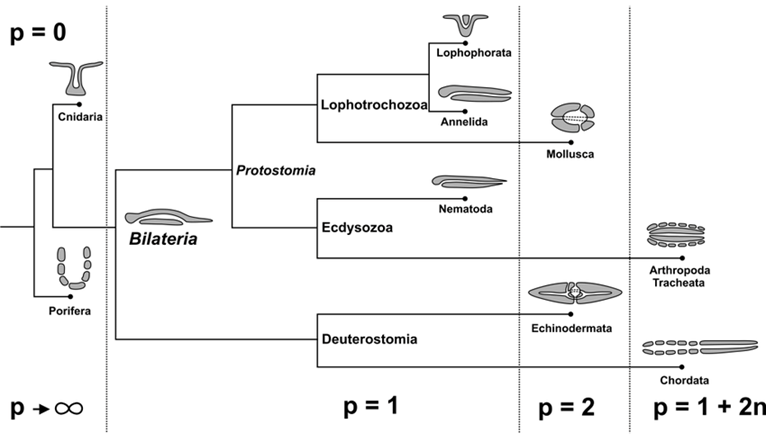
Fig. 16. Example of surfaces and metazoan body plans, s (sphere), t (torus), t’ (toroid). The Möbius strip (1a) is neither closed nor orientable, the Klein bottle (1a), while closed, is not orientable. Different deformations of a sphere (b). A torus (c). Metazoan development and body plans (d-h), bold lines represent epithelia, stitches indicate fusion of epithelia, m (mouth), a (anus). Topological body plan of a polyp or medusa (both topological spheres) and colonial or budding stages (toroids) (d). Bilaterian development and body plans, except for flatworms, there is a transition from sphere to torus during the formation of the second opening of the primitive gut (e-i). Nematode (h). Vertebrate (i). (Jockusch & Dress, 2003)
Metazoan evolution can be studied using concepts from mathematical topology, such as the Euler characteristic and the genus. The topology of a surface M is determined by its Euler characteristic: χ (M) = V − E + F, where V, E, and F are the numbers of vertices, edges and faces (Jockusch & Dress, 2003). This number can be calculated from any triangulation of M. The Euler characteristic is closely related to the genus g(M), the number of ‘handles’ or ‘holes’ created by handles. The identity χ (M) = 2 − 2g(M) holds true for every closed, connected and oriented surface M (Jockusch & Dress, 2003). For example, spheroids have genus 0 and Euler characteristic 2 while tori have genus 1 and Euler characteristic 0.

Fig. 17. Parallel between topological and functional innovations in Metazoan evolution. Transition to genus p = 1 + 2n means adding an even number of holes to the respiratory system for better utilization of oxygen flowing through the organism and more intensive metabolism (Isaeva, Kasyanov, & Presnov, 2014).
The chemical and mechanical basis of Hydra morphogenesis
Turing’s chemical reaction-diffusion model, as discussed in the first section of this paper, has significantly shaped our comprehension of morphogenesis. Yet, a recent proposition introduced a complementary biophysical perspective that considers a mechanical morphogen field, specifically the nematic orientation of actin fibers, as a determinant in directing morphogenesis (Maroudas-Sacks et al., 2021). This proposition extends the framework of morphogenesis established by Turing.
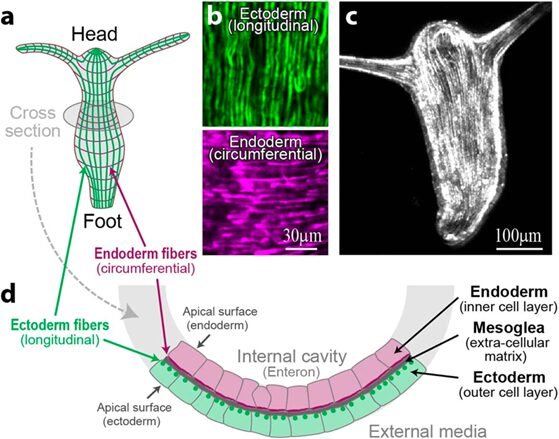
In a mature Hydra, organized parallel supracellular actin fibers form contractile structures called myonemes in its double-layered epithelium (Maroudas-Sacks et al., 2021). Myonemes connect through cell-cell junctions and demonstrate long-range directional order. In the framework of liquid crystals, such parallel alignment is indicative of systems with nematic order, where microscopic constituents tend to align parallel to each other locally. Systems are termed active if their constituents expend energy and generate forces, resulting in a range of compelling dynamic behaviors (Maroudas-Sacks et al., 2021). Thus, the arrangement of supracellular actin fibers in Hydra aligns with the characteristics of an active nematic system.

Fig. 18. In the outer cell layer, the fibers align along the body axis, while in the inner cell layer, they align perpendicular to it (Maroudas-Sacks et al., 2021).

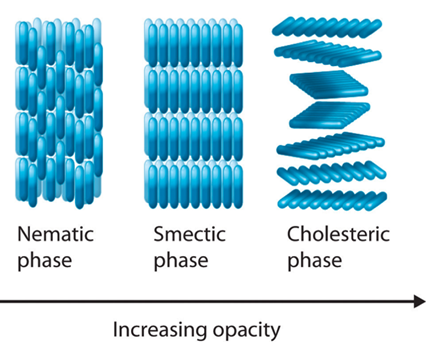
Fig. 19. In condensed matter physics, a liquid crystal is a state of matter which flows like a liquid but has some degree of order in the arrangement of its molecules. It can have different systems of order, which include the nematic order (Averill, B., & Eldredge, P. 2013). Epithelia have been described as active liquid crystals.
Topological defects and their charge
In an ordered system, a topological defect is an unremovable point of disorder or discontinuity. Imagine a group of fish in a pond which must align head to tail with each other. If the fish at the boundary point in a clockwise direction, as shown in the image below, then other fish can arrange themselves in concentric circles to comply with the condition. However, the fish at the center could not point in a direction such that it is continuous with the other fish, creating a point of disorder. This example illustrates a topological defect, the fish being analogous to liquid crystal constituents.
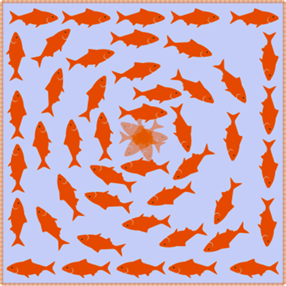
Fig. 19. An illustration of a topological defect using fish in a pond (John Sandford O’Neill’s).
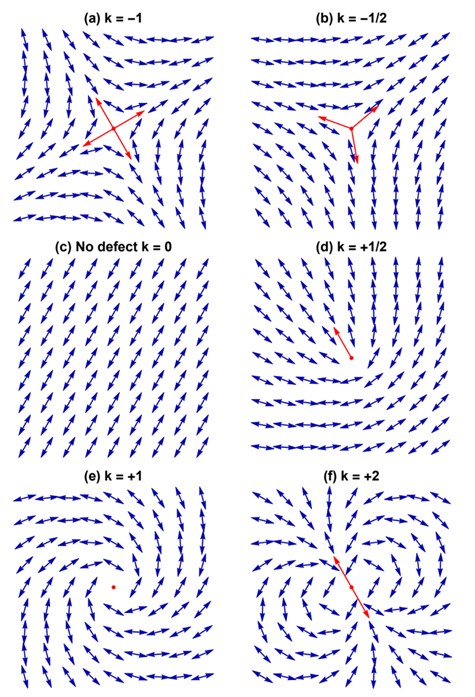
Each defect in a system possesses a “charge”, describing the pattern of orientation around it. Charges from all defects sum up into a net charge, which is restricted by the topology of the system (Maroudas-Sacks et al., 2021). Topological charge is determined by the change in the orientations of liquid crystal constituents in a closed curve around the defect point: ∮dθ=2πk. The charge k can be any integer multiple of +1/2, with ±1 and ±1/2 defects corresponding to ±2π and ±π rotation in the constituents’ alignment. If nematic constituents are confined on a spherical surface, like the topology of a Hydra, the total topological charge must be +2, which can be achieved by combining an arbitrary number of defects with charges that sum up to +2.

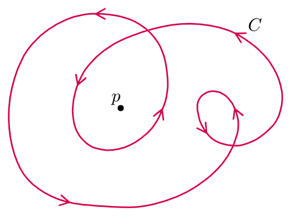
Fig. 20. Topological charge, or winding number, is the number of times the director orientation rotates around the center of the defect. This curve has winding number 2 around the point p. (Jim.belk)

Fig. 21. Examples of defects and their topological charge k in a 2D nematic liquid crystal, with red arrows indicating the defect orientation. (Tang & Selinger, 2017)
In Hydra, topological defects in the nematic system of actin fibers have been observed to become organization centers in morphogenesis, where important features like the head or foot emerge (Maroudas-Sacks et al., 2021). In fact, defects have been shown to affect the dynamics of cell monolayers, particularly in mechanical feedback. Alterations in the local stress field surrounding the defects correlate with changes in cell behavior, including cell death and extrusion in epithelial sheets. Researchers hope to extend this idea to actin fibers in Hydra, since mechanical feedback is believed to play a central role in their formation and alignment (Maroudas-Sacks et al., 2021).
Topological defects as organization centers in morphogenesis
In Hydra, regions of aligned fibers induce order in neighboring regions. However, when regenerating, the topological constraint of the spherical surface means that topological defects must emerge. In fact, the generated defects in Hydra are long-lasting and display diverse dynamics, such as mobility (points of defect can move around), merging (two defects can merge), and annihilation of pairs of defects (Maroudas-Sacks et al., 2021).
All tissue fragments and cell aggregates fold into a spheroid before developing into a new polyp. The defect configuration depends on the geometry of the extracted tissue, which influences the initial actin fiber organization in the folded spheroid. Typically, +1 defects are found in regions of high positive surface curvature, whereas −1/2 defects tend to be in saddle regions with negative curvature (Maroudas-Sacks et al., 2021). Mature Hydra only exhibit +1 and −1/2 defects, whereas regenerating tissue spheroids also exhibit +1/2 defects. Over time, +1/2 defects are eliminated, and a +2 total charge is achieved, complying with the topological constraint.
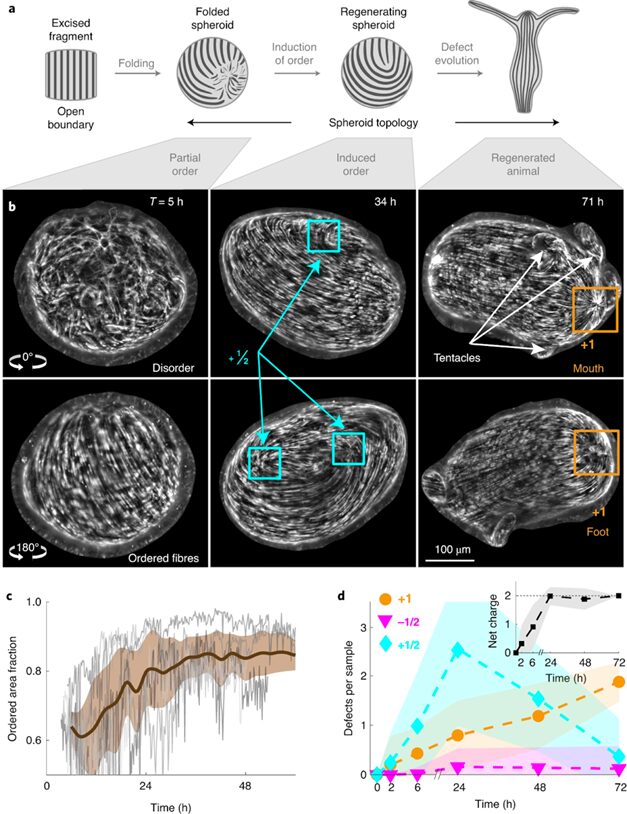
Fig. 22. (A) Induction of order over time leads to the formation of localized topological defects (middle-right), which evolve over multiple days as the tissue regenerates into a mature Hydra. (B) Topological defects and their charges, each pair of images showing two sides of the tissue. (C) Area fraction containing ordered fibers over time. (D) Number of defects by charge over time (Maroudas-Sacks et al., 2021).
What is perhaps most indicative of the driving force topological defects represent in morphogenesis is the fact that, the +1 defects originating from newly aligned fibers in the initially disordered regions correlate strongly with head formation, whereas +1 defects originating from merging two previously formed +1/2 defects correlate with foot formation on the opposite side (Maroudas-Sacks et al., 2021). In other words, the defects set the body axis and work as organizational centers for morphogenesis. Furthermore, defects emerge during the formation of tentacles as well as in budding. In both cases, two −1/2 defects emerge at the base with a +1 defect at the tip, as the tentacle or bud begins to protrude.
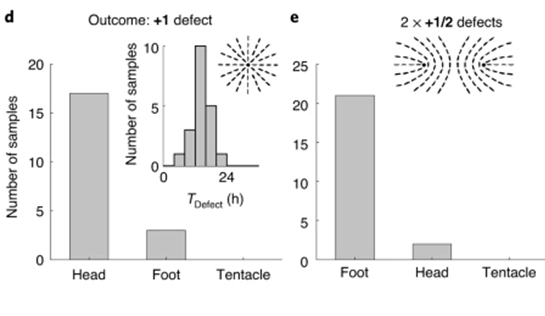
Fig. 23. Original +1 defects correlate with head formation (left), whereas +1 defects from merging 2 +1/2 defects correlate with foot formation (right) (Maroudas-Sacks et al., 2021).
The aster (radial) fiber arrangement at the +1 defects implies that there is a lack of fibers spanning cell–cell boundaries there, potentially weakening local cell adhesion in contrast to regions with ordered fibers (Maroudas-Sacks et al., 2021). Additionally, during tissue contractions, a high level of tension is expected at the defect point as the focal point of pulling forces applied by actin fibers contracting from all directions. Both the weaker adhesion and higher tension make +1 defect sites more susceptible to rupture. Thus, the mechanical environment at these defect points reinforces the morphogenetic processes that lead to the required biological specialization.
Engineering using topological defects
The increasing body of research on topological defects in living systems suggests that Hydra and other animals have evolved not only a chemical mechanism through which to control morphogenesis, but also a mechanical one that relies on physical properties at the defect sites. Applying the understanding of topological defects in biological systems can help us design advanced biomaterials and tools for guiding biological processes. For instance, a study used liquid crystal elastomers to artificially induce formation of topological defects to control cell positions, density, and even functions like cell signaling and mechanotransduction (Ardaševa & Doostmohammadi, 2022). Furthermore, topological defect structures can possibly inspire the design of self-organizing and self-healing composites.
Conclusion
Due to its reliance on an innate immune system, the microbial communities surrounding Hydrae play a key role in its development and survival. As such, its ability to regulate and encourage the bacterial colonisation process to ensure a favourable cohabitation with its microbiota hints at amazingly complex interactions between the host and bacteria which are the result of millions of years of coevolution. For instance, after hatching, the systematic downsizing of Bacteroidetes population and the incessant fluctuation in the bacterial community as the host slowly matures show the presence of niches designed to allow certain types of bacteria to flourish while extinguishing others. Consequently, the fight for dominance on the host epithelia mimics a competitive environment with unknown selective pressures that can be mathematically modelled. In doing so, it is revealed that abundance-dependent fitness encourages a certain amount of diversity, while the environmentally/host-dependent colonisation rate factor indicates a hidden selection pressure that ultimately selects a dominant symbiotic bacteria that will benefit the host. The holobiont selectivity, though its mechanisms are still poorly understood, shows a fascinating design solution to adapting to the pressure of the microbial world. The Hydra also has a design solution for the regeneration of its basal disk. Without the method of feedback inhibition for the regeneration of the animal’s basal disk, it would encounter the problem of having too many basal disk cells. Therefore, the animal evolved the ability to regulate feedback inhibition and thus the number of epidermal cells differentiating into basal disk cells. This continuous process can be mathematically modelled and allows for the Hydra to be able to attach and detach to a surface without having to recover the lost mucus. Additionally, there is a design solution for the regeneration of the Hydra’s body. This follows different regeneration patterns where dynamic feedback loops regulate regeneration in response to changing conditions. The organisms adjust their regenerative response based on ongoing signals and environmental cues. This can then be modeled mathematically following a specific spatial pattern. A complementary biophysical explanation of Hydra morphogenesis and regeneration is provided using tools from mathematical topology.
References
Ardaševa, A., & Doostmohammadi, A. (2022). Topological defects in biological matter. Nature Reviews Physics, 4(6), 354-356. https://doi.org/10.1038/s42254-022-00469-9
Bosch, T. C. G., & Miller, D. J. (2016). The Holobiont Imperative. https://doi.org/10.1007/978-3-7091-1896-2
Ettinger, S. (2017). Chapter 1 – Obesity and Metabolic Syndrome. In S. Ettinger (Ed.), Nutritional Pathophysiology of Obesity and its Comorbidities (pp. 1-26). Academic Press. https://doi.org/https://doi.org/10.1016/B978-0-12-803013-4.00001-6
Franzenburg, S., Fraune, S., Altrock, P. M., Künzel, S., Baines, J. F., Traulsen, A., & Bosch, T. C. (2013). Bacterial colonization of Hydra hatchlings follows a robust temporal pattern. The ISME Journal, 7(4), 781-790. https://doi.org/10.1038/ismej.2012.156
Gierer, A. (2012). The Hydra model-a model for what?
Isaeva, V. V., Kasyanov, N. V., & Presnov, E. V. (2014). Topology in Biology: Singularities and Surgery Transformations in Metazoan Development and Evolution. Applied Mathematics, 05(17), 2664-2674. https://doi.org/10.4236/am.2014.517255
Jockusch, H., & Dress, A. (2003). From sphere to torus: A topological view of the metazoan body plan. Bulletin of Mathematical Biology, 65(1), 57-65. https://doi.org/10.1006/bulm.2002.0319
Lipowsky, R. (1991). The conformation of membranes. Nature, 349(6309), 475-481. https://doi.org/10.1038/349475a0
MacWilliams, H., Kafatos, F., & Bossert, W. (1970). The feedback inhibition of basal disk regeneration in Hydra has a continuously variable intensity. Developmental Biology, 23(3), 380-398.
Marciniak-Czochra, A. (2006). Receptor-based models with hysteresis for pattern formation in hydra. Mathematical biosciences, 199(1), 97-119.
Maroudas-Sacks, Y., Garion, L., Shani-Zerbib, L., Livshits, A., Braun, E., & Keren, K. (2021). Topological defects in the nematic order of actin fibres as organization centres of Hydra morphogenesis. Nature Physics, 17(2), 251-259. https://doi.org/10.1038/s41567-020-01083-1
Meinhardt, H. (2012). Turing’s theory of morphogenesis of 1952 and the subsequent discovery of the crucial role of local self-enhancement and long-range inhibition. Interface Focus, 2(4), 407-416.
Tang, X., & Selinger, J. V. (2017). Orientation of topological defects in 2D nematic liquid crystals. Soft Matter, 13(32), 5481.
Turing, A. M. (1952). The chemical basis of morphogenesis. Bulletin of mathematical biology, 52, 153-197.