


Abstract
Apart from physical and chemical solutions used by the diatom for survival, some features of the unicellular microalgae also could be described in mathematics. For instance, the diatom morphology reveals a striking alignment with the golden ratio and fractal geometry. By examining the silica shells of these unicellular algae, we uncover patterns that suggest an evolutionary drive toward geometric optimization. The golden ratio emerges not just as an aesthetic detail but as a structural advantage, potentially influencing diatom resilience and resource efficiency. The complex surface patterns of diatom shells through fractal dimensions illuminate their role in ecological interactions like light capture and nutrient uptake. The fractal nature of extracellular polymeric substance (EPS) pad formation hints at a sophisticated resource distribution strategy, modeled through the recursive algorithms of the Lindenmayer system. We inform the integrative mathematical concepts and aim to decode the growth logic of diatom frustules. It proposes that diatom shapes, far from being mere biological curiosities, are manifestations of an innate mathematical order.
Introduction
The diatom, a seemingly simple single-celled organism surrounded by a glass shell, features an excitingly wide variety of species comprised of many shapes and structures. The geometry of these diatoms hides beautiful fractals and ratios that can only be described through mathematics. Not only that, through the morphogenesis of frustule valves and the formation of diatom colonies, researchers can observe the active creation of patterns and structures up close. Throughout this essay, mathematics will be used as a tool to explain the true beauty of the diatom.
With diatoms taking rectangular, elliptical, circular, and triangular forms, to name a few, there is no doubt that it is a challenge to model all these shapes. Nevertheless, mathematicians managed to find not one, but two separate methods to approximate the shape of different diatoms. Using parametric curves in 3-D space, both pennate and centric diatoms can be modelled. By simply changing the scaling constants of the curves, the shapes of many specific pennate and centric species can be accurately displayed. What is arguably more impressive is the Gielis Superformula, a single equation that aims to model not only diatom shapes but the shapes of many other organisms as well. By specifying the parameters, both bilaterally and radially symmetric diatoms can be modelled and adjusted to accurately approximate the real organism.
While diatom geometry is fascinating, it is not just there for aesthetics. The high surface area-to-volume ratio allows diatoms to thrive in many bodies of water, improving their nutrient uptake in iron-depleted conditions. Furthermore, the increased surface area allows greater temperature regulation, lending to the diatom’s ability to withstand both hot and cold temperatures in a fluctuating environment. Fascinatingly, diatoms use complex mathematical shapes to their advantage. The golden ratio is present in the design of centric diatom pores, allowing for space usage and resource allocation efficiency. Fractals are another useful feature of this organism, allowing increased control of nutrient absorption and light harvesting.
Analyzing mature diatom frustules is very interesting, but there is an equally captivating observation to be made with the developing valves. During asexual reproduction, a genus of centric diatom creates beautiful valve patterns that transform as they progress, until they are sadly covered up by the maturation of the frustule. Similarly, researchers can tell a lot about diatoms from their maldevelopment. Diatoms that show deformities in their typical geometry from inhibited frustule development can clue ecologists in on metal contamination in bodies of water.
By taking a step back from the individual diatom, much can be learned from diatom chains. A special case presents itself in Diatoma Vulgaris, a diatom that forms chains through replication, creating hinge-like connections. Interestingly, the placement of extracellular polymeric substance (ESP) pads on the mother cell single-handedly determines the resulting connection between the daughter cells. Due to this unique quality, researchers can predict with certainty both the past and future generations of a specific chain.
Due to the immense variety of diatom species, there are plenty of mathematical concepts to explore relating to the organism. Although only scratching the surface of mathematical concepts relating to the diatom, this paper aims to explore both the static beauty of diatom geometry and structure, as well as the dynamic beauty of fleeting patterns created from valve morphogenesis and algorithmic replication of Diatoma Vulgaris chains.
Mathematical Modeling Of The Diatom Shape
Diatoms have some of the most impressive and varied shapes across all current living beings. As you can see in Figures 1 and 2, diatom shapes can vary wildly between rectangular, elliptical, circular, and even triangular shapes. This of course creates problems when it comes to mathematically modeling the shape of these different diatoms as a function of some sort. This section will explore the research that has been made in recent years to attempt to solve those problems and present models for the diatom shape.
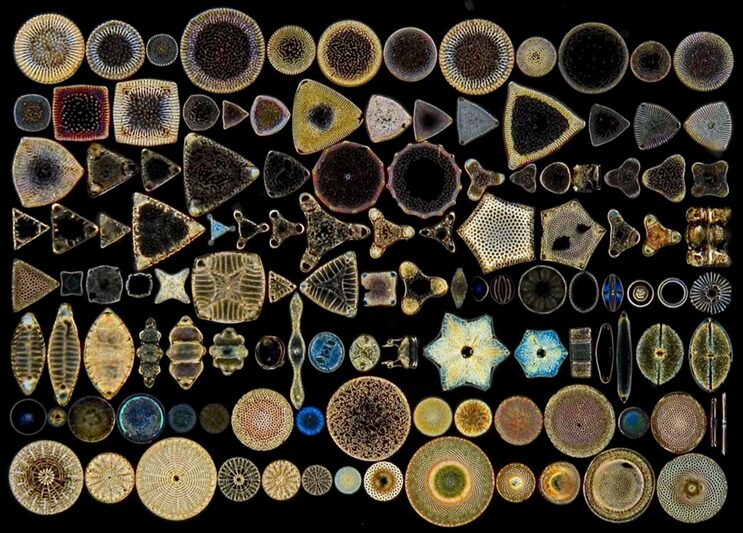
Figure 1: Different diatom shapes. Notice how the symmetries are wildly different across these diatoms (Franchini, 2023).
Parametric Curves And Surfaces Of Diatoms
Generally, diatoms have 2 main classes of shapes. First, there are the pennate-shaped diatoms which are characterized by two joined arcs of circles with similar diameter (Pappas, 2005). As such, these diatoms will exhibit bilateral symmetry. You can refer to Figure 1 for examples of real diatoms that have that shape (specifically you can look at the 6th diatom on the first column of Figure 1 as it is an example of a pennate diatom). Then, the second main class diatoms are the centric diatoms which are circular and radially symmetric. These are also present in Figure 1 mainly on the first row. Due to the apparent circular shape of these diatoms (especially the centric ones), the researchers hypothesized that their shapes could be achieved using a combination of conic curves (these are curves that are obtained by slicing through a cone, or the intersection of planes on the cones) and these functions are: the circle, the ellipse and the hyperbola (Pappas, 2005).
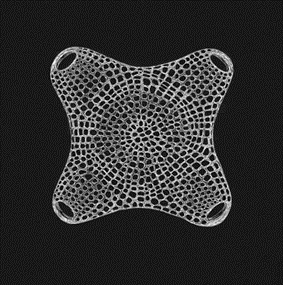
Figure 2: Microscopic image of Biddulphia antediluviana (Brodie, 2003).
This hypothesis was proven to be correct as Dr. Janice L Pappas describes multiple parametric curves using a combination of hyperbolic and sinusoidal functions in her 2005 paper. These hyperbolic and sinusoidal functions are a parametrization of the conic sections in 2-D and 3-D Euclidean space. For example, the following parametric describes a surface that is very similar to the shape of a pennate diatom (Pappas, 2005):
x=3 sin(t/2)
y=0.5 sech(t)*tanh(10u)
z=sin(0.5t)

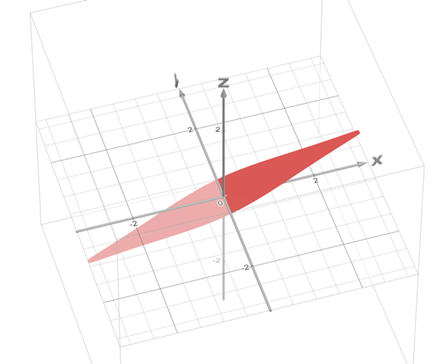
Figure 3: A visual graph of the parametric surface φ. This was graphed using the desmos 3d calculator. The resemblance with the pennate diatoms from the figure n is uncanny. Note however, that this parametric surface does not display any of the pores. This is an improvement that can be made, but that is also very hard to model.
This surface (figure 3) can also be used to characterize more generally the family of pennate diatoms. This can be done by changing the scaling constants present in the function. Doing so will lead to stretches in multiple directions which can be used to model more accurately a specific diatom species. The paper gives many more examples of these parametric curves and surfaces that can describe various families of diatoms. We encourage you to explore those and even try plotting some of these formulas on graphing calculators like we did.
The Gielis Formula
Another way present in the literature to model diatom shapes is by using the Gielis superformula. This was discovered by the mathematician Johan Gielis in the early 2000s, and he released a paper describing it in 2003 (Gielis, 2003). The formula’s goal is to be able to describe the shape of different living organisms simply by varying the parameters of the formula. This has been already applied to different organisms including bamboo sticks, tree leaves, and more importantly in the context of this paper, diatoms. This formula is interesting and so we will explore how this formula was first derived, its properties and the properties of its parameters, and finally how some of the obtained shapes can approximate diatoms.
The superformula is a modification of the Lamé curves which themselves are a generalization of ellipses (Gielis, Haesen, & Verstraelen, 2005). So, let us first examine the equation of an ellipse in the cartesian plane:
(x/a)^2+(y/b)^2=1
Where a, and b are arbitrary real constants that determine the length of the horizontal and vertical axis. This elliptical function can be even more generalized to not be centred at (0,0), but this is not needed in this case. The Lamé curves are then just a generalization of the exponents of x and y. Instead of only being 2, the Lamé curves are functions that can take any number in the exponent and the resulting shapes are called superellipses (Gielis, Haesen, & Verstraelen, 2005)! These curves will have the following formula:
|x/a|^n+|y/b|^n=1
Then, to further generalize this formula to describe an even larger number of shapes: the formula will take the Lamé curves and change the coordinate system to polar instead of Cartesian where x=rcos(θ) and y= rsin(θ). Also, the power on both of the x and y components are allowed to be different and the parameter theta inside the sin and cos is multiplied by m/4 which will influence the rotational symmetry of the geometric curve. The result is a function where the radius (r, from the polar coordinate system) changes depending on the angle θ (Gielis, Haesen, & Verstraelen, 2005):
r=(|(cos(mθ/4))/A|^{n_2 }+|(sin(mθ/4))/B|^{n_3} )^{(-1)/n_1 }Additionally, this formula can be multiplied by an arbitrary function (f) of theta. This is also sometimes called the Gielis transformation of a planar function (De Tommasi, Gielis, & Rogato, 2017). The most interesting thing about this formula is the parameter m which defines the degree of rotational symmetry (refer to Figure 4 for visual support). Simply put, the degree of rotational symmetry is the number of angles by which you can rotate the figure around its center where the resulting shape is the same as the original shape. For example, the square looks the same after 90°, 180°, 270°, and 360° of rotation so it is of order 4. This property of varying symmetry of the shape is extremely useful for modelling diatoms that also have very different orders of symmetry from one species to the next (De Tommasi, Gielis, & Rogato, 2017).
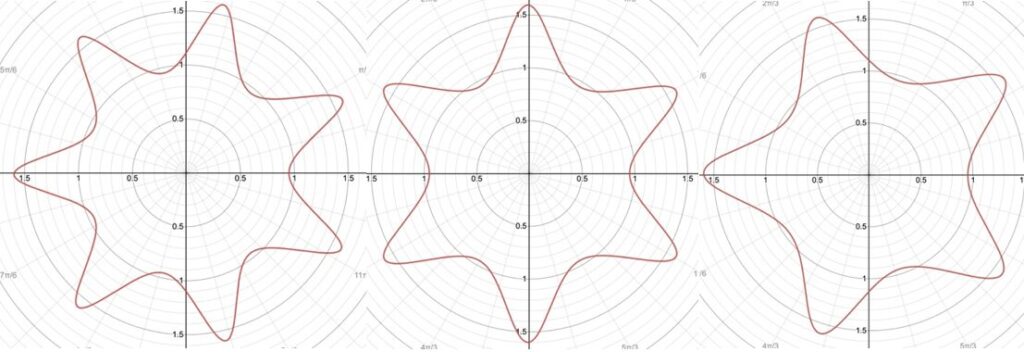
Figure 4: The effect of the parameter m on the shape of curves obtained from the Gielis curve. All parameters are the same except from m whose value is 7, 6, and 5 respectively. These shapes were drawn using the online 3-D calculator Desmos.
This formula can be used to approximate the shape of the Biddulphia antediluviana that is present in Figure 2. Observing this diatom, it is quickly obvious that its order of rotational symmetry is 4. So, by setting m=4 and adjusting the other parameters so that its shape can most resemble the diatom, the following curve can be obtained:
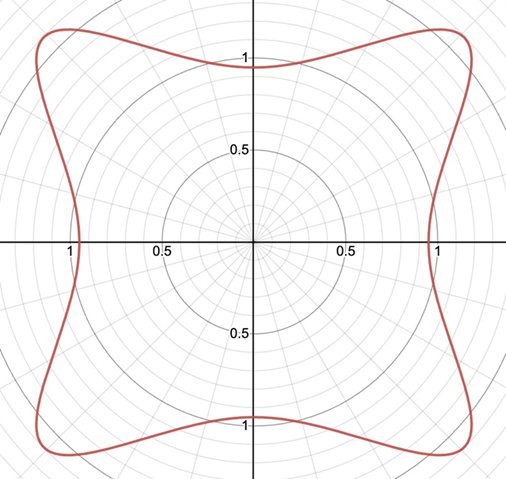
Figure 5: Model of the Diatom Biddulphia antediluviana using the Gielis equation with m=4, n1=4.8, n2=9, n3=9.4, A=B=1, and f(θ)=0.95. This model closely resembles the diatom. This graph was made using the Desmos 3-D online calculator and the link for this graph is: https://www.desmos.com/calculator/t3arlavggf. We encourage you to play around with the parameters on the left side to better understand the formula and to try and model some of the diatom shapes from Figure 1.
More generally, when m=2 (so a two-fold symmetry) the resulting graphs will tend to look like the pennate diatoms previously mentioned, when m=0 the graphs will describe the centric diatoms, and when m=3 the equation will produce curves resembling the triangular diatoms (De Tommasi, Gielis, & Rogato, 2017).
Mathematical modelling of the diatom shape can eventually lead to a better understanding of why there are so many different diatom shapes and what factors influenced a certain diatom to exhibit a specific symmetry instead of another. It will lead us one step closer to understanding the relationship between structure and function in biology (De Tommasi, Gielis, & Rogato, 2017). Additionally, having even simple mathematical functions to describe a diatom shape can allow us to quickly compute properties like perimeter, area, curvature and much more as mathematicians have spent centuries developing tools for the analysis of curves. This will also be useful for future simulations of diatoms and even for certain applications in nanotechnology (De Tommasi, Gielis, & Rogato, 2017; Pappas, 2005).
Valve Morphogenesis
While Gielis curves and parametric equations describe the plethora of shapes a mature diatom can have, there is equally beautiful geometry involved in the formation of diatom valves. As a diatom cell undergoes mitosis, its epitheca (older, usually larger) and hypotheca (younger, usually smaller) will slowly separate as the two newly formed daughter cells create their own hypotheca within the protoplast (Cox et al., 2012). Valve formation is taxon-specific, ordered, highly patterned, and always occurs outward from a center point as depicted in Figure (6). During the formation of such thecae, intricate crystalline structures will be created and sometimes even hidden once the valve is fully matured (Tiffany & Nagy, 2019). With the help of imaging techniques such as Scanning Electron Microscopes (SEM), fascinating patterns shown on Figure (9) can be retrieved during the silification of immature hypothecae.
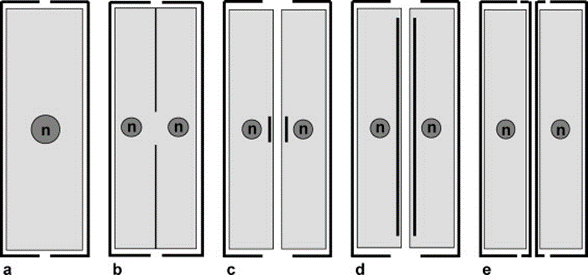
Figure 6: The progression of hypotheca formation during diatom mitosis. (a) Initial cell. (b) Mitotic division into two cells inside one frustule. (c)-(d) Formation of hypotheca originating from center point. (e) Two distinct diatoms (Cox et al., 2012).
Centric Valve Morphogenesis. Firstly, it is interesting to note that, during asexual reproduction, the size reduction of a centric diatom is allometric, meaning that its girdle height remains constant while its diameter decreases as seen in Figure (7) (Cox et al., 2012).
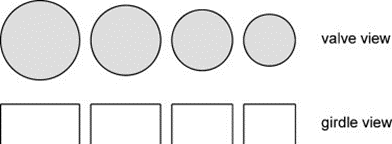
Figure 7: Reduction of valve radius during asexual reproduction of centric diatom, maintaining constant girdle height throughout reproduction (left to right) (Cox et al., 2012).
By examining simulations of centric diatom frustule formation, researchers get a better understanding of how geometric patterns form, as well as how they are affected by external conditions. Figure (8) shows the difference in ordered structure when comparing silica growth using diffusion-limited aggregation (DLA; left) to silica growth using specific particle release sites (right) (Parkinson et al., 1999). The DLA aggregate shows branched, fractal structures while the aggregate grown using distinct release sites shows straight branches emanating from the center point. This simulation gives insight into the growth of centric diatom costae, which are rib-like emanations that provide structural support to the frustule. To create these costae, the silicon deposition vesicle (SDV) must deposit new material at specific points along its perimeter which reveals the role of microtubules for localized deposition in valve formation. Additionally, observing the results of Figure (8), temperature and surface tension affect the shape and thickness of the aggregate. At low surface tension and high temperatures, the aggregate tends to split into droplets. At high surface tension and low temperature, the aggregate becomes very rounded, and in the case of Figure (8a), less branched. As displayed in Figure (8b), depending on the conditions of a diatom’s environment, its costae can be formed with varying thickness, with low surface tension and low temperature creating thinner ribs or high surface tension and high temperature creating thicker ribs. With future work in mind, the simulation could theoretically be modified to model pennate frustule growth by altering the border of silica growth.
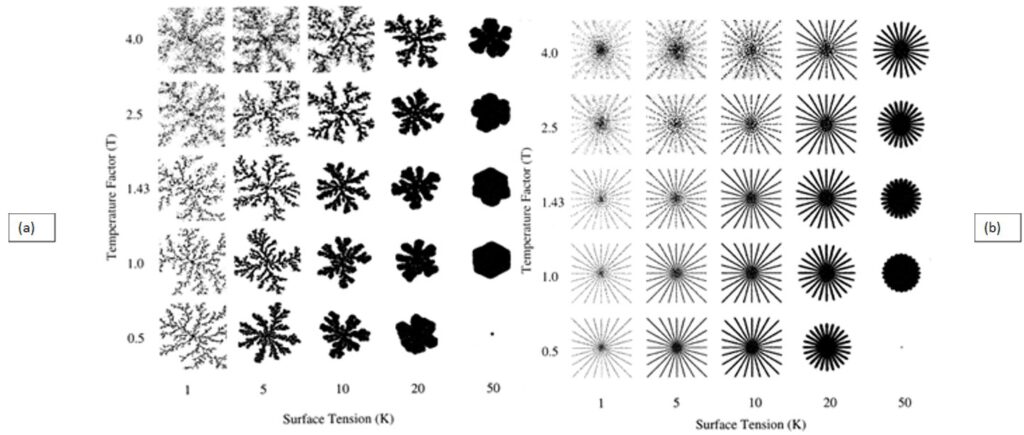
Figure 8: (a) Diffusion-limited aggregation (DLA) and (b) Specific particle release site aggregation of silica in varying Temperature Factor (T) and Surface Tension (K) conditions (Parkinson et al., 1999).
A fascinating example of a silica pattern lost to the maturation of a diatom valve comes from the genus Asterolampra. Initially beginning with the formation of a hexagonal wall pattern, triangles of silica form evenly spaced across the surface as shown in Figure 9(a)-(b) (Tiffany & Nagy, 2019). Then in Figure 9(c)-(d), they connect and expand to create intricate designs that may even be featured in an art gallery. Unfortunately, once fully developed, the frustule of Asterolampra loses most of its uniqueness and assumes a classic diatom surface with evenly spaced circular pores.
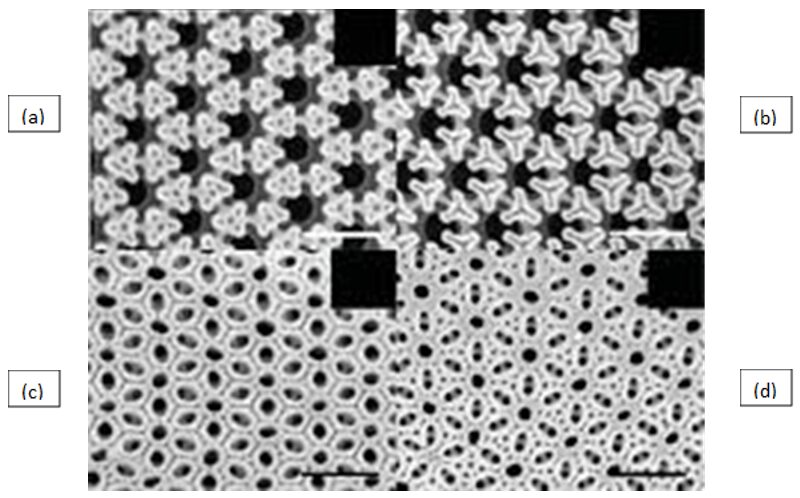
Figure 9: The maturation (a)-(d) of the external surface of valves of Diatom Asterolampra Marylandica at high magnification (Tiffany & Nagy, 2019).
Pennate Valve Morphogenesis. Similar to the asexual reproduction of the centric diatom, pennate diatoms also experience allometric size reduction shown in Figure 10, except while the length of a diatom decreases, the valve width remains constant (Cox et al., 2012). When analyzing the difference between the growth of raphid (with raphe(s)) and araphid pennate diatoms, there is a notable difference between the integrity of each model. Observing Figure 11, the raphid genus Gomphonema displays thick ribs that outline the raphe slit with a high degree of bilateral symmetry, while the araphid genus Synedra displays a thin central sternum with a staggered formation of ribs.
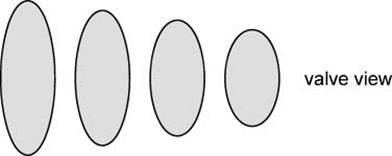
Figure 10: Reduction of valve length during asexual reproduction of pennate diatom, maintaining constant width throughout reproduction (left to right) (Cox et al., 2012).
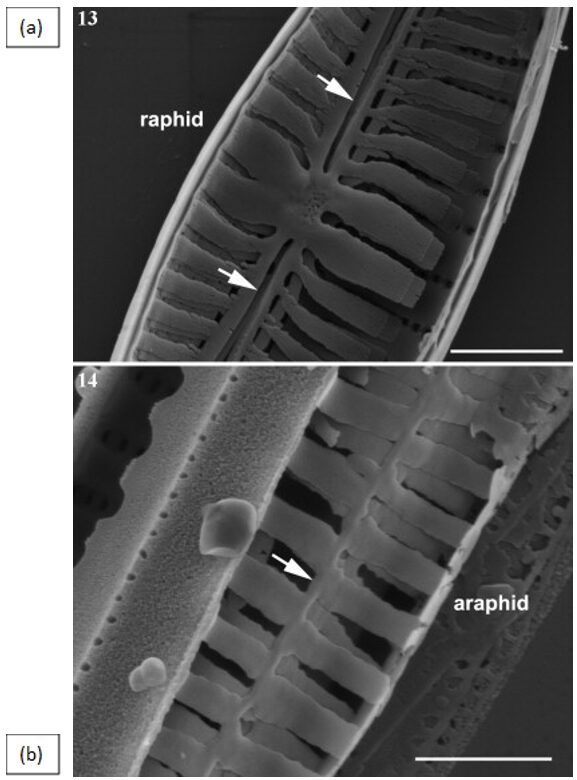
Figure 11: (a) Raphid Diatom Gomphonema. Arrows pointing at raphe slits, outlined by thick ribs. (b) Araphid Diatom Synedra. An arrow is pointing at the thin central sternum (Cox et al., 2012).
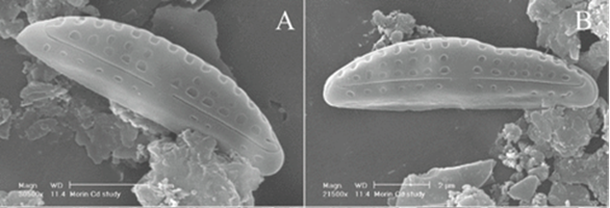
Morphological Deformities. In the presence of high concentrations of metal, certain components of diatoms such as microtubules, vesicles, and the cytoskeleton can be damaged or inhibited (Morin et al., 2008). As a result, silica deposition can be directly affected, causing visible deformities to arise in newly synthesized frustules. For example, when exposed to high concentrations of cadmium, it was observed that the abundance of frustule deformities rose substantially. It is also interesting to note that deformities were more abundant in raphid and araphid diatoms than in monoraphid and centric diatoms, as well as being more prevalent in smaller diatoms. Figure 12 shows an example of an abnormal frustule (af) of the pennate diatom Amphora Pediculus compared to its normal frustule (nf). By further researching this topic, scientists may be able to observe diatom deformities to assess the level of metal contamination in bodies of water.
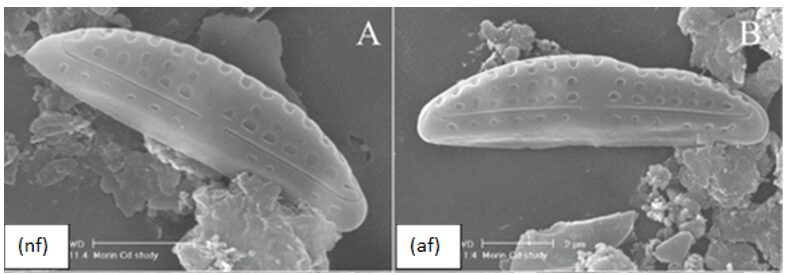
Figure 12: Pennate Diatom species Amphora Pediculus exposed to high concentrations of cadmium. Normal Frustule (nf) with no visible deformities compared to Abnormal Frustule (af) with a “dent” on the top right section (Morin et al., 2008).
Surface Area To Volume Ratio
Nutrient absorption is crucial for all cells, particularly in the competition among different species in the ocean for the same resources. Denitrifying bacteria, heterotrophic bacteria, and phytoplankton all compete for nitrate molecules. Diatoms, despite being immobile and unable to move towards nutrient-rich areas like decaying fecal pellets, are still highly diverse and arguably the most abundant and successful of all phytoplankton. This paradox, where diatoms thrive despite apparent limitations in nutrient acquisition and lack of mobility, presents an ongoing, unresolved puzzle in the study of aquatic microorganisms (Robert G et al. 2003). How do diatoms manage to contend with neighbouring bacteria and mobile phytoplankton for nourishment?
Diatoms, being non-motile, rely on alterations to their surface for competition. Their silica-based cell walls, or frustules, allow for designs with a higher surface area to volume ratio compared to more spherical organisms like bacteria and most eukaryotic phytoplankton. Not all diatoms, however, adopt a thin disk shape to maximize this ratio. A universal characteristic among diatoms is their surface texture, made up of micro and nano-sized structures forming pores and chambers. We are not sure whether the microstructure in their frustules is important in up-taking nutrients and competition. Indirect indications come from the observation that the disk-shaped diatoms, Coscinodiscus sp. and Thalassiosira pseudonana, exhibit contrasting growth behaviours in response to turbulence. The variation in size does not fully account for the differences in their growth rates. Researchers noted that Coscinodiscus sp. proliferated more rapidly in turbulent conditions, while T. pseudonana thrived better in calm waters. To date, there is no established connection between their unique surface configurations and their ecological thriving. (Peters F et al. 2006) In addition, a significant group of phytoplankton adapts to iron scarcity by reducing cell size, which increases their surface area-to-volume ratio and potentially enhances nutrient uptake efficiency. This change in size also affects the silicon content in diatoms, with some iron-limited diatoms exhibiting different silicification levels compared to those in iron-rich environments. The study suggests that these adaptations, particularly the changes in surface area relative to volume, could be crucial for diatoms in iron-limited regions of the ocean ( de Baar et al. 2012).
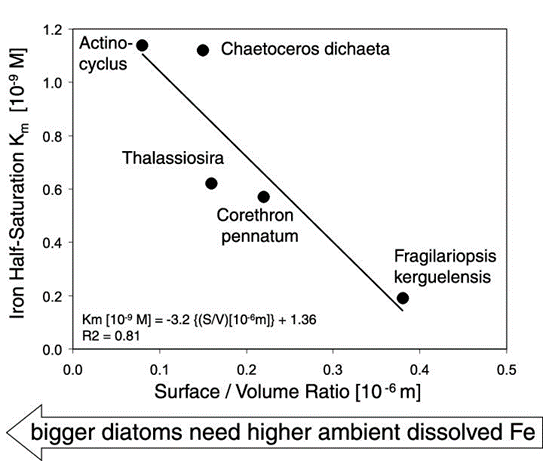
Figure 13: Inverse relationship between surface/volume ratio of medium-sized and large-sized Antarctic diatoms versus the half-saturation value K m for growth m/m max = [Fe]/(K m + [Fe]) after Monod [1942]. Shown are large Fragilariopsis kerguelensis and larger Corethron pennatum, Thalassiosira, and very large Actinocyclus sp., the latter very similar in perfect discoid shape and 300-400 mm size to Asteromphalus sp. (Waite and Nodder, 2001). Graph plotted after K m data of dissolved Fe (nM) growth curves (not shown here) in natural Antarctic seawater; see Timmermans et al. [2004] for these growth curves.
The surface area to volume ratio in the diatom also relates to climate change. When the climate gets warmer, small-celled diatom species, particularly within the Cyclotella genus, are favoured due to increased stratification and altered nutrient ratios. This shift in diatom community structure indicated that smaller diatoms with higher surface area to volume ratios adapted better to changing environmental conditions, suggesting a significant role of this ratio in their ecological adaptation and success. The smaller diatoms with larger surface area ratios can regulate temperature more efficiently, an advantage in fluctuating thermal environments. The high surface area-to-volume ratio in diatoms aids in temperature regulation through the process of heat exchange with their environment. A larger surface area relative to volume allows for more efficient heat exchange, as there is more surface area through which heat can be absorbed or released. In cooler environments, this can help the diatom absorb heat more effectively from its surroundings. Conversely, in warmer conditions, a larger surface area facilitates the release of heat, preventing the diatom from overheating. This efficient thermal regulation is especially crucial for maintaining optimal enzymatic and metabolic activities within these microscopic organisms (Coats R et al. 2006).
As the volume of a cell increases, the ratio of surface area to volume decreases, the abundance of such diatoms decreases, which is a common pattern observed in nature due to the increased resources larger cells require.
log(cell~abundance [cells[ml^{-1} ])=a - b*log_2 (cell~volume [m^3])Figure 14: A linear regression model was applied to the octave (log2) scale of diatom cell volume (x-axis, μm3) and the log-transformed values of relative cell abundance (y-axis) for each individual species of diatom (Rodriguez J, et al. 2001).
Golden Ratio and Fractal Dimension
As in many organisms, the golden ratio which is closely related to the Fibonacci sequence allows for efficient growth. Diatoms also display this efficiency in design which allows for maximized space usage and resource allocation. The golden ratio also enhances stability and resistance to environmental stressors, contributing to the durability and longevity of the diatom. Finally, the ratio can be associated with self-similar and scale-invariant properties that allow for maintaining functionality across different scales and conditions (Liu & Sumpter, 2018).
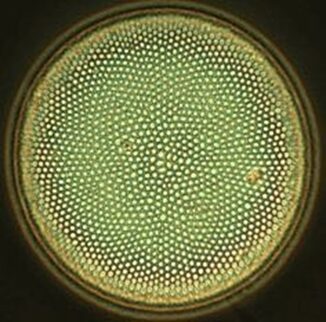
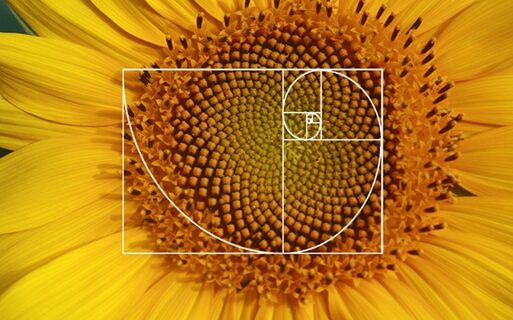
Figure 15: The image displays two examples of natural occurrences of the golden ratio: a diatom and a sunflower. Both exhibit patterns that are commonly associated with Fibonacci sequences, where the arrangement of elements can be mathematically related to the golden ratio (approximately 1.618) (Edward A. 1969).
Self-similarity (a property where parts of the diatom’s structure, at different scales, resemble the whole or other parts) and scale invariance (certain properties of the diatom to remain unchanged under a scale transformation.) are also shown in the diatom patterns which allows diatoms to grow and change in response to environmental stress without losing functionality because fractal geometries in the frustule are inherently adaptable. Also, scale invariance in their structures could contribute to maintaining buoyancy, as certain fractal patterns can trap gases, helping diatoms remain in the photic zone where there is enough light for photosynthesis. The self-similarity and scale invariance can be described with fractal mathematics. (Donald L. Turcotte et al. 2003)
The Fractal Dimension (Nf) of the diatom could be calculated by the Hausdorff method. The Nf is an indicator of the geometry complexity from structural patterns, in this case, diatoms morphology.
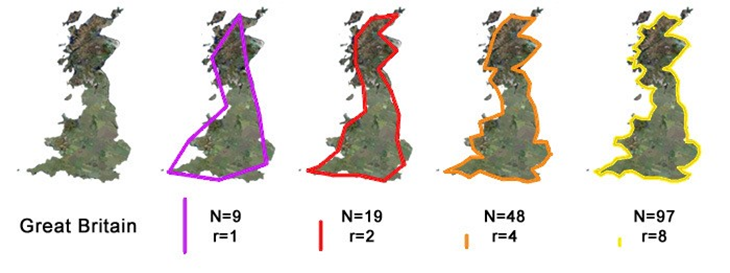
Figure 16: Define r to be the magnification factor, which is the inverse of the ruler length. N is the value of the perimeter.
To measure the fractal dimension of the diatom we use the formula:
D=(log(N))/(log(R))
Typically, self-similarity in natural formations is present up to a limited number of levels and comes with some irregularities. It is improbable for a smaller segment to be an exact replica of a larger segment; thus, the self-similarity is not exact but rather an approximation. Two parameters were considered to measure self-similarity: Nf and the projection (θ) (a scaling angle used to describe the geometry of the pattern) (Pestana-Nobles, R. et al 2023).
Formula to calculate projection:
θ= cos^{-1} ((CC [I,Im]*CCauto [I] )/‖CC[I,Im]‖‖CCauto[I]‖ )(Note: I is the diatom image, Im is the diatom image with the symmetry operation, CC[I, Im] is the CC calculated between I and Im, and CCauto[I] is CC calculated for I (where the CC matrices became vectors). Basically, the projection between these two vectors is obtained by the dot product divided by the product of the norms of these.
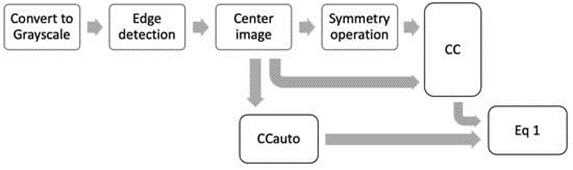
Scheme 1: The essential preprocessing stages required for computing θ.
If the value of θ is approximately zero or very close to it, this suggests a high level of symmetry regarding the operation. Conversely, suppose θ is around ninety degrees or close to that. In that case, it points to a lower degree of symmetry for the operation (the operation does not produce a pattern that is as uniformly or regularly arranged as one with a higher degree of symmetry).
The integration of the Nf parameter with self-similarity effectively distinguishes the morphological variations in diatoms. Nf represents the geometry of diatoms characterized by a base structure that is irregular or fragmented, recurring across various scales. Diatoms with a fractional dimension can be readily distinguished from others using this parameter. The presence of self-similarity in a diatom implies that its measurement is straightforward in instances of fractional similarity; in such cases, fractal dimensions serve as the suitable parameter. A higher fractal dimension indicates a more complex pattern with a higher degree of self-similarity. This complexity can be related to various biological functions, such as nutrient absorption or light harvesting. (Pestana-Nobles, R. et al 2023)
Diatom Chains
As we have discussed previously, many species of diatoms organize themselves into chains. The most widely accepted hypothesis for this is to maintain the diatom colonies within the photic zone (Gebeshuber & Crawford, 2006). We can also suggest the idea that this is done to better allow diatoms to transmit light to other members of their colony via the optical properties of the frustules. No matter the reason, this is a widely observed phenomenon, which can occur via mechanical attachment, or with the use of biological adhesive, depending on the species. These adhesives are very generally called extracellular polymeric substances, or EPS.
Diatoma vulgaris is one such species which forms chains by linking with the use of EPS. As seen in Figure 17, the EPS pads are located on the corners of the diatom frustules, which creates zigzag-like chains.
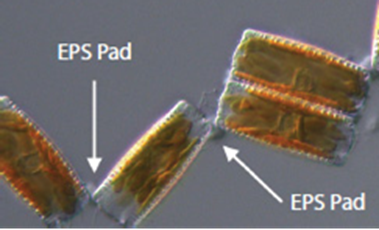
Figure 17: A segment of a chain of D. vulgaris. The EPS pads are present at the corner intersections of neighbouring diatoms. The rightmost unit is in fact two diatoms still joined together at the center (Harbich, 2023).
The method of chain formation is as follows: As one diatom reproduces, it becomes two diatoms connected in the middle, as seen in figure 17. These diatoms then separate from each other at one end, while an EPS pad forms at the other end, creating the hinge-like form.
In the context of modelling and math, it is natural to wonder which end of the diatom is chosen to be the connected end and to try to determine a model for the formation of diatom chains.
Determining where the EPS pad will form
There are four possible combinations of EPS location on a single diatom, assuming we always maintain the same orientation in terms of what is up, down, left, and right, and they are shown in the figure below:
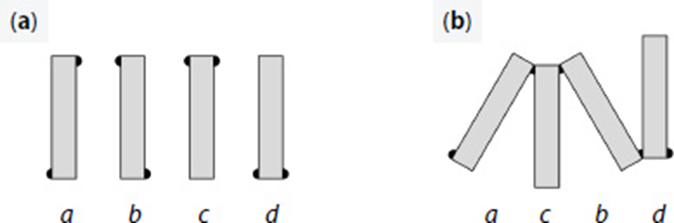
Figure 18: (a) Visualization and assignment of letters to each of the possible configurations of EPS pads on D. vulgaria, and (b) an example of a diatom chain composed of these units (Harbich, 2023).
Because of the nature of diatom reproduction, the two frustules from the original diatom are still present as the outermost frustules of the new pair of daughter cells, and so the overall configuration of the new unit is identical to that of the mother cell (Kröger & Poulsen, 2008). A type a diatom splits into two new diatoms, one with an EPS pad on the bottom of its left frustule, and the other with one on the top of its right frustule. With these conditions, a limited number of possibilities for new diatom pairs exists, and they too can be defined.
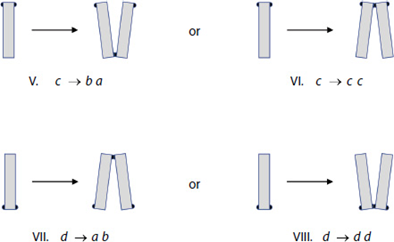
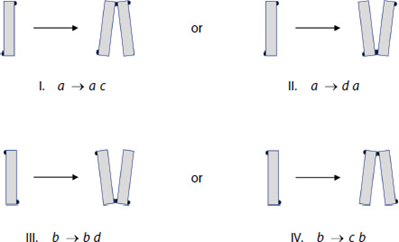
Figure 19: All the possibilities of new EPS pad locations on daughter cells of diatoms (Harbich, 2023).
Harbich observed two important things about these possibilities over many colonies of D. vulgaria. First, possibilities I and III are significantly favoured for the reproduction of a and b diatoms. Second, the possibilities labelled VI and VIII never occur! This is quite striking and leads to another nice observation: when c and d diatoms reproduce, the only diatoms formed are a and b diatoms. In his study of D. vulgaria, Harbich also observed that in a synchronized diatom chain, i.e. a chain in which all diatoms are of the same generation, the daughter cells of type c and d diatoms separate before the daughter cells of type a and b diatoms. This is not fully understood, but we will not dwell on it here. In combination with the earlier observation, this leads to a cycle being created: As reproduction occurs in a chain with any assortment of diatoms, a moment exists where all diatoms and diatom pairs are either type a or b, which makes the whole chain into a beautiful zigzag, if only for a few moments, before returning to a random assortment when the a and b pairs separate. This cycle can be observed in parts (a) through (c) of Figure 20:
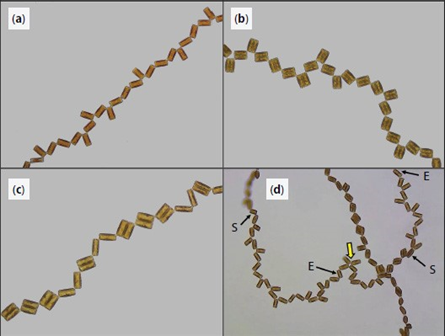
Figure 20: (a) to (c): sequential images of a diatom chain as it goes through the cycle of reproduction and separation (Harbich, 2023).
This displays the beginnings of some pattern and the beginnings of the possibility of determining a way to predict chain formation.
D. vulgaria chains as Lindenmayer systems
Lindenmayer systems are rewriting systems that were originally proposed to describe the development of biological systems, such as plants. Lindenmayer systems are created by defining a set of letters, which are the pieces or units of the system, rewriting rules, which allow the system to evolve and develop, and an initial axiom, which is the starting point of the system (Ochoa, 1998). It turns out that we have already defined our letters and our rewriting rules, so we can now use these as a Lindenmayer system to predict diatom chains stemming from a single cell.
A reminder of the rewriting rules, for a simplified Lindenmayer system:
For type a and b diatoms, only processes I and III can occur:
a → ac; b → bdc
For type c and d diatoms, only processes V and VII can occur:
c → ba; d → ab
This models a completely deterministic Lindenmayer system, meaning that we can say with certainty what the result will be, there is no element of chance present, and it is also context-free because the processes of the diatoms are independent of the processes undergone by their neighbours (Ochoa, 1998). If we add processes II and IV back into our possibilities, we must then determine a way of defining their probabilities, and this adds many layers of complexity to the model and makes it stochastic.
With our simple model, and assuming that all diatom chains are synchronous, we can go backwards and forwards between generations of diatom chains.
For example, if we write out the following chain:
d a c
The first step is to develop the c and d diatoms, they separate first as seen earlier:
ab a ba
And then develop the a diatom from the first generation:
ab ac ba
a b a c b a
If we continued to develop this chain, we would eventually come to the conclusion that any sequence of letters that is present at one time will eventually present itself again in a later generation, which is quite remarkable (Harbich, 2023). In fact, this is reminiscent of the concept of fractals, which are shapes made up of themselves, relying on recursion and a never-ending feedback loop (What are Fractals?). Although diatoms do not express this exactly, it is still an impressive connection.
This Is Very Powerful And Interesting, But Is It Useful?
We can use this kind of model for different types of diatoms who chain together in these ways to predict which kinds of shapes and configurations they will produce, and better understand how they respond to their environment. In the case of D.vulgaria, chains form as long filaments that attach to a substrate, allowing them good access to nutrients and light (Harbich, 2023). The ordering of their separation processes is essential in this as if they did not maintain a system, they would form chains which interfere with themselves, or form loops, or any other shape that is not conducive to their best survival. Other diatoms, such as D.tenuis, form star shapes, which allow them to float better and remain in the photic zone (Harbich, 2023). If we observed and modelled their behaviour, it would surely also be possible to create a system which results in the formation of these shapes, and never the long filamentous chains of diatoms.
Conclusion
In the world of the diatom, the primary challenge is to remain in the photic zone. One might compare it to the habitable zone of our solar system. If the diatom sinks too far or floats too high, it will not be able to correctly perform photosynthesis, and thus be unable to properly produce many of the nutrients it requires. Many of the diatom design solutions are centred around this issue, and we have seen more examples of this in this paper.
First, the many different types of diatoms and their symmetry were studied. Diatoms can be classified by their morphology into groups such as centric and pennate, which describe round and pennate-shaped, bilaterally symmetrical diatoms, respectively. Pushing this further, we are even able to formulate mathematical methods to describe closely many different shapes of diatoms, such as those with 4 or more axes of rotational symmetry. Although these models do not directly relate to any known design solutions of diatoms, they are invaluable tools to better understand these organisms and determine more of their design solutions. One of the great questions of diatoms is what leads each species to have such a distinctive shape, and these models and formulas could lead us in the direction of an answer.
Next, the important considerations of surface and volume were studied. These are very important factors for all living organisms, and diatoms can control these factors at different times. During reproduction, frustules decrease in radius, while girdle bands maintain their height, which allows the diatoms to increase their surface-to-volume ratio during this time. Diatoms can also modify their size as a reaction to nutrient scarcity or competition with other organisms, to improve their survivability.
Then, the fractality of diatoms was investigated. Fractals are present in various ways throughout diatoms, including their overarching geometry and their porosity during the morphogenesis of the frustule. This fractality is an important characteristic in the fabrication of the frustule, as having even the slightest imbalance in evenness and distribution of silica in these hard cell walls can cause many defects in the optical properties of the diatoms, as well as their protection. Fractals are also observed in the high-level structures that compose the diatoms, in the form of self-similarity. Centric diatoms are most recognized for this, and this is a factor which is important for their buoyancy, keeping them in the photic zone, where living conditions are right for them, by trapping bubbles of gases.
Finally, the ability of chain-forming diatom species to reproduce in such a way that the resulting chains produce shapes that are perfectly suited to the environments and situations they find themselves in. Some, like D.vulgaria, form long chains which attach to surfaces, allowing every diatom on the chain to be well exposed to nutrients flowing in the water and to be at the correct depth to receive the optimal amount of light. This system is impressive, as diatoms have no (known) communication methods or consciousness of their situation or colony members. It is so well designed that we can construct a predictive model for how these chains form and observe repeated patterns in their structure. This extends to other species of diatom such as D.tenuis, which forms star-shaped chains adapted to its needs. These formation methods are very sophisticated, preventing diatom chains from colliding with themselves.
Overall, the design solutions of diatoms are numerous, and if they had been invented by a conscious individual, one would have no choice but to call them ingenious. It is no wonder that diatoms dominate the world of phytoplankton as they do.
References
Brodie, C. (2003). Geometry and Pattern in Nature 1: Exploring the shapes of diatom frustules with Johan Gielis’ Superformula. http://www.microscopy-uk.org.uk/mag/indexmag.html?http://www.microscopy-uk.org.uk/mag/artapr04/cbdiatom2.html
Cox, E. J., Willis, L., & Bentley, K. (2012). Integrated simulation with experimentation is a powerful tool for understanding diatom valve morphogenesis. Biosystems, 109(3), 450-459. https://doi.org/https://doi.org/10.1016/j.biosystems.2012.05.012
De Tommasi, E., Gielis, J., & Rogato, A. (2017). Diatom Frustule Morphogenesis and Function: a Multidisciplinary Survey. Marine Genomics, 35, 1-18. https://doi.org/https://doi.org/10.1016/j.margen.2017.07.001
Franchini, W. (2023). The Collecting, Cleaning, and Mounting of Diatoms. https://www.mccrone.com/mm/the-collecting-cleaning-and-mounting-of-diatoms/
Gebeshuber, I. C., & Crawford, R. M. (2006). Micromechanics in biogenic hydrated silica: Hinges and interlocking devices in diatoms. Proceedings of the Institution of Mechanical Engineers, Part J: Journal of Engineering Tribology, 220(8), 787-796. https://doi.org/10.1243/13506501jet163
Gielis, J. (2003). A generic geometric transformation that unifies a wide range of natural and abstract shapes. Am J Bot, 90(3), 333-338. https://doi.org/10.3732/ajb.90.3.333
Gielis, J., Haesen, S., & Verstraelen, L. (2005). Universal natural shapes: From the supereggs of Piet Hein to the cosmic egg of Georges Lemaitre. Kragujevac Journal of Mathematics, 28, 57-68.
Harbich, T. (2023). Pattern Formation in Diatoma vulgaris Colonies. In The Mathematical Biology of Diatoms (pp. 265-290). https://doi.org/https://doi.org/10.1002/9781119751939.ch10
Kröger, N., & Poulsen, N. (2008). Diatoms—From Cell Wall Biogenesis to Nanotechnology. Annual Review of Genetics, 42(1), 83-107. https://doi.org/10.1146/annurev.genet.41.110306.130109
Liu, Y., & Sumpter, D. J. T. (2018). Is the golden ratio a universal constant for self-replication? PLoS One, 13(7), e0200601. https://doi.org/10.1371/journal.pone.0200601
Morin, S., Coste, M., & Hamilton, P. B. (2008). SCANNING ELECTRON MICROSCOPY OBSERVATIONS OF DEFORMITIES IN SMALL PENNATE DIATOMS EXPOSED TO HIGH CADMIUM CONCENTRATIONS1. Journal of Phycology, 44(6), 1512-1518. https://doi.org/https://doi.org/10.1111/j.1529-8817.2008.00587.x
Ochoa, G. (1998). An Introduction to Lindenmayer Systems. Retrieved 11/30/2023 from https://www1.biologie.uni-hamburg.de/b-online/e28_3/lsys.html
Pappas, J. L. (2005). Geometry and topology of diatom shape and surface morphogenesis for use in applications of nanotechnology. J Nanosci Nanotechnol, 5(1), 120-130. https://doi.org/10.1166/jnn.2005.009
Parkinson, J., Brechet, Y., & Gordon, R. (1999). Centric diatom morphogenesis: a model based on a DLA algorithm investigating the potential role of microtubules. Biochimica et Biophysica Acta (BBA) – Molecular Cell Research, 1452(1), 89-102. https://doi.org/https://doi.org/10.1016/S0167-4889(99)00116-0
Pestana-Nobles, R., Villarreal-González, R., Galan-Freyle, N. J., Aranguren-Díaz, Y., Machado-Sierra, E., Yime-Rodríguez, E., & Pacheco-Londoño, L. C. (2023). Cross-Correlation and Fractal Analysis in the Images Diatoms Symmetry. Applied Sciences, 13(8), 4909. https://www.mdpi.com/2076-3417/13/8/4909
Rodríguez, J., Tintoré, J., Allen, J. T., Blanco, J. M., Gomis, D., Reul, A., Ruiz, J., Rodríguez, V., Echevarría, F., & Jiménez-Gómez, F. (2001). Mesoscale vertical motion and the size structure of phytoplankton in the ocean. Nature, 410(6826), 360-363. https://doi.org/10.1038/35066560
Sheath, R. G., & Wehr, J. D. (2003). 1 – INTRODUCTION TO FRESHWATER ALGAE. In J. D. Wehr & R. G. Sheath (Eds.), Freshwater Algae of North America (pp. 1-9). Academic Press. https://doi.org/https://doi.org/10.1016/B978-012741550-5/50002-7
Tiffany, M. A., & Nagy, S. S. (2019). The Beauty of Diatoms. In Diatoms: Fundamentals and Applications (pp. 33-42). https://doi.org/https://doi.org/10.1002/9781119370741.ch3
Turcotte, D. L. (2003). Tectonophysics. In R. A. Meyers (Ed.), Encyclopedia of Physical Science and Technology (Third Edition) (pp. 499-511). Academic Press. https://doi.org/https://doi.org/10.1016/B0-12-227410-5/00763-8
What are Fractals? Fractal Foundation. Retrieved 12/1/2023 from https://fractalfoundation.org/resources/what-are-fractals/