


ABSTRACT
Mathematical models and functions are familiar tools used to study biological systems and interactions, in particular with the study of infectious diseases. Epidemic and pandemic dynamics, however, are only one example of their applications for adding analysis, understanding, and insight into complex topics. In this essay, cyanobacteria’s size and growth patterns can be described using allometric power functions, and other mathematical models that emphasize the dynamic state of this organism with phenotypic plasticity. Then, geometrical models describe how shape fluctuations and gliding motility are interconnected. Filamentous cyanobacteria and cyanobacterial trichomes can both be modelled as semi-flexible rods, and persistence lengths in particular, meaning the relative bending stiffness can be studied to determine how morphology influences interactions with the environment. Additionally, studying the geometry of organelles, such as the carboxysome, reveals intricate designs that contribute to homeostasis and efficient photosynthesis. Indeed, hexamers, pseudohexamers, and pentamers are key structures impacting the selective permeability of the carboxysome shell.
INTRODUCTION
Mathematics are fundamentally present and interwoven in nature. From the symmetry in many plants, to fractals which are infinitely repeating patterns across all scales of object, to geometry such as the nearly perfect hexagonal honeycomb: it is present all around us. We just have to look for it. Humans have used mathematical and computational models to mimic some of the patterns present in nature such as fractals using iteration. Mathematical models can also be used to study the interactions of organisms, functions of organelles, validate experimental data, and even make predictions such as the behaviour of a complex biological system. They are useful tools especially for determining interactions of molecules in metabolic pathways and gaining other data that cannot be easily procured from experimental settings. After a cyanobacterial Microcystis aeruginosa bloom in 1989 caused many animal deaths in Leicestershire, the National River Authorities recommended the use of such models to predict cyanobacterial growth depending on environmental conditions in the effort to better manage and predict their behaviour (Guven & Howard, 2006). Since then, models on their migration, buoyancy regulation, and growth have been developed aiding effective management plans. Cyanobacteria continue to be investigated and mathematical models such as these will provide newfound insights and even give ideas of what the future can hold.
This essay will explore mathematical models and functions at the level of colonies, the cell, and organelles. Colony formation, cyanobacterial morphology, and the structure of carboxysomes will be presented to shine a light on how mathematics can be applied in the context of organisms and their natural designs. Cyanobacterial colonies are created through binary fission in multiple planes and are kept together with a sheath, whereas trichomes, that is cyanobacterial cell chains, are only developed in one plane (Castenholz, 2015). Binary fission is an asexual reproduction process that creates two identical daughter cells. In the case of cyanobacteria this can involve either growth of each envelope layer inwards, or the invagination of the cytoplasm and subsequent formation of the peptidoglycan layer (Castenholz, 2015). Cyanobacteria form considerable amounts of biofilm in which they are present as a colony while attached to a surface, as described in the physics essay: “Mechanics and Optics of Cyanobacteria: How to Survive over Billions of Years.” Carboxysomes are specialized microcompartments in cyanobacteria cells that regulate the concentration of CO2 and contain Rubisco enzymes which are involved in converting CO2 to organic compounds. These organelles along with the various cyanobacterial morphology will be described further below.
MATHEMATICAL BENEFITS OF COLONY FORMATION
Size-growth dependence
As organisms get larger, their morphological complexity increases, both on a large and small scale. Planktonic organism size is restricted by factors like water turbulence, limiting them to sizes smaller than the smallest turbulent eddy (0.2-0.4 mm). Metabolic rate further limits maximum size due to decreased specific surface area with increased volume, affecting molecular transport within cells. Additionally, the shape of microalgae affects various vital components such as sinking velocity, mucilage production, vacuoles, and storage products (Borics et al., 2023).
In many studies on living organisms including animals and some bacteria, a relationship between body size and growth rate can be described as an allometric power function:

(Nielsen, 2006)
Where W is the size or mass of the body, and the rate describes either metabolic rate or growth rate. In cases where the rate pertains to either a specific metabolic rate or a specific growth rate, the exponent “b” has been seen to be either -0.33 or -0.25. This is the general idea of size-dependent growth that most organisms have been shown to follow (Nielsen, 2006). In studying cyanobacteria, this relationship seems to be followed, to a certain degree as shown in Figure 1, and Table 1.
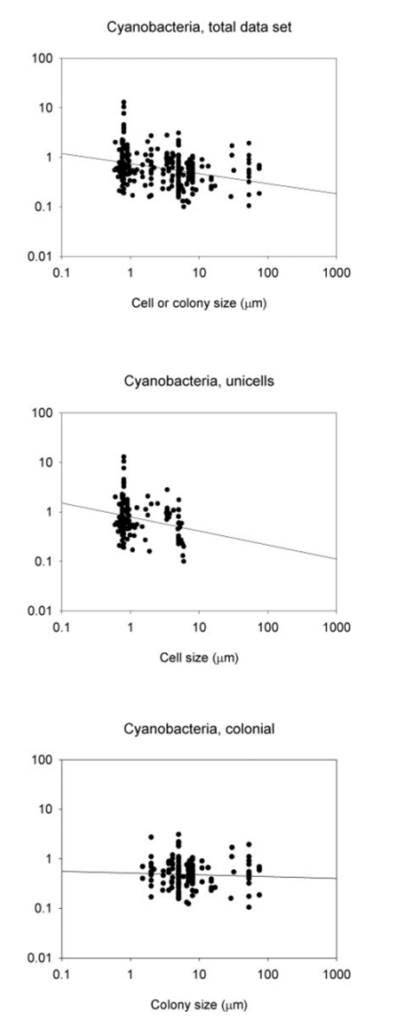
Figure 1. The connections between maximum growth rates and the size of cells or colonies, represented by the thickness/length of the minor axis, depicted for cyanobacteria. The visualizations include relationships within the entire data sets, along with subsets of data focusing on unicells and colonies. The lines on the graphs represent the fitted least-squares regression lines (refer to Table 1) (Nielsen, 2006).
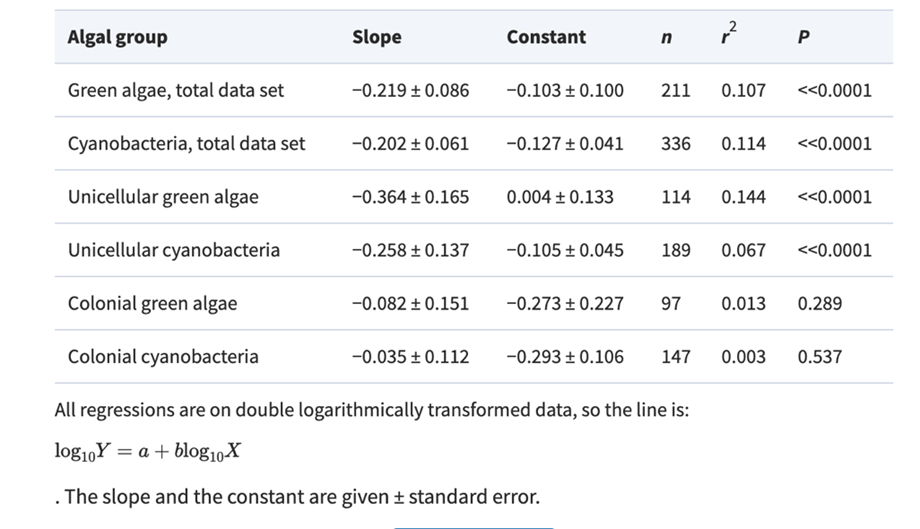
Table 1. Slope, constant and regression statistics for the least-squares regressions lines in Fig. 1 (Nielsen, 2006).
Focusing on the cyanobacteria, when considering unicellular cyanobacteria alone, it is evident that they exhibit a stronger correlation between size and growth compared to studies that include both unicellular and colonial forms. The reason behind this stronger allometric relationship in unicells becomes apparent when analyzing data for colonial forms alone as there is no correlation between size and maximum growth rate in cyanobacteria.
Over the course of their evolutionary journey, cyanobacteria have chosen a path of minimal cell-level morphological differentiations. Rather than investing in complex cell structures, they have demonstrated mastery in creating diverse morphologies through the strategic use of colonization. This plays a crucial role in sustaining elevated surface-to-volume ratios, even as colonies grow larger (Borics et al., 2023). It is hypothesized that colonial growth form evolved as a solution to the challenge of size-dependent growth, where growth rates typically decrease with increasing size. By adopting a colonial structure, these species can overcome the limitations of size-dependent growth and achieve higher growth rates compared to unicells of similar size (Nielsen, 2006). This works for cyanobacteria, as even though these colonies may become quite heavy, and thus increase their sinking velocity, they can apply physical techniques such as buoyancy regulation (see cyanobacteria physics essay) (Borics et al., 2023).
Colonies and Predation
Interesting relationships between colony formation and decreased predation have been found, and thus colony formation becomes a survival solution for these remarkable organisms (Ranjbar et al., 2021). Chemical cues induced by the grazing of predators are proposed to be the cause of the formation of colonies in the cyanobacteria (Kong, 2012).
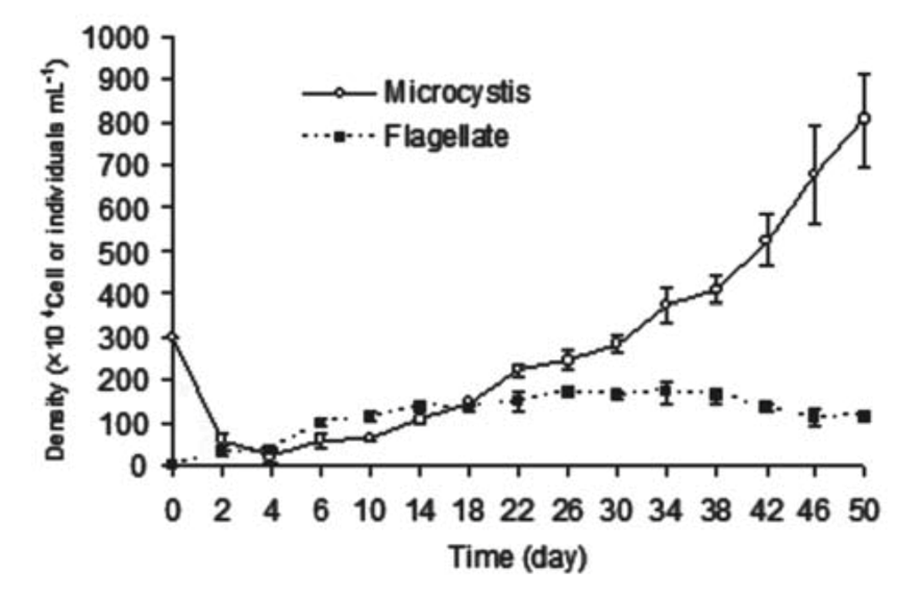
As shown in Figure 2, a study done on the cyanobacterial species Microcystis aeruginosa where the bacteria were mixed in a tube containing flagellate, the predation pressure causes an increase in cell density.

Figure 2. Changes of cell density of M. aeruginosa and flagellate in a mix-cultivating system where flagellate are predators of M. aeruginosa (Kong, 2012).
The flagellate (Ochromonas sp.) effectively reduced the population of unicellular Microcystis aeruginosa. In just 4 days of co-cultivation, the M. aeruginosa density dropped from 3.0 million to 2.2 million cells per milliliter, while the flagellate density increased to 1.0 million cells per milliliter. However, the flagellates did not completely eliminate M. aeruginosa, and its density started to increase again after the 6th day. By the 30th day, the M. aeruginosa density had recovered to 3.0 million cells per milliliter and reached 8.05 million cells per milliliter on the 50th day. In contrast, the flagellate density remained stable at around 1.0 million cells per milliliter after the 6th day. This suggests that while the flagellates initially reduced the M. aeruginosa population, they were not able to prevent its resurgence over time (Kong, 2012).
Another group of researchers developed a model called the Comprehensive Cyanobacterial Model (CCM) based on this idea, but instead modeling the phenotypic plasticity and defensive morphologies of cyanobacteria in response to zooplankton predation (Serizawa et al., 2009). Cyanobacteria possess a remarkable capability known as phenotypic plasticity, wherein they undergo morphological changes from the unicellular type to the colonial or filamentous type in response to zooplankton grazing activities (Ji et al., 2020). This research on a dynamic model for cyanobacteria focuses on a bitrophic system involving unicellular and colonial algae and herbivorous zooplankton and consolidates various nutrient influences into a single carrying capacity (Serizawa et al., 2008).
The mathematical model proposed by Serizawa et al. is a system of the following differential equations:


(Serizawa et al., 2008)
The three variables, P for unicellular algae biomass, Q for colonial algae biomass, and Z for herbivorous zooplankton biomass, are all measured in g/m³. Time is represented by the variable t in days. Both unicellular and colonial algae follow the logistic equation for local growth, with a shared maximum growth rate r. The carrying capacity (K) for total algal biomass, including both unicellular and colonial algae, is influenced by nutrient availability.
Efficiency of inducible morphological changes is gauged by the parameters c and g, denoting the scaling constant (c), the half-saturation constant for this effect (g). Zooplankton’s selective feeding on unicellular and colonial algae is a crucial aspect of the model. Parameters  and
and  represent zooplankton search rates on unicellular and colonial algae, respectively.
  is the handling time of zooplankton on unicellular algae,
  is a constant linked to the handling time on colonial algae, and η is the assimilation coefficient of zooplankton on algae.
Assuming the handling time of zooplankton on colonial algae is proportionally related to colonial algae biomass Q, parameter  estimates the increasing rate of handling time on colonial algae. The actual handling time on colonial algae is then represented as
  . Thus, and are crucial parameters describing zooplankton’s functional responses while grazing on colonial algae. Other parameters include
  ,
,  , and
, and  , representing the mortality rates of unicellular algae, colonial algae, and herbivorous zooplankton, respectively (Serizawa et al., 2008).
The overall conclusion of this model leads to the proposed consequence that cyanobacteria exhibit bistability, the ability of a dynamic system to have two equilibrium states (Serizawa et al., 2008; Serizawa et al., 2009).
GEOMETRY OF CYANOBACTERIA MORPHOLOGY
Across the phytoplankton community, the evolution of body shape in microorganisms is constrained by geometry and is revelatory of their functional adaptation. Phytoplankton, including cyanobacteria, are considered to be the most geometrically diverse groups of organisms on Earth. Indeed, cyanobacteria come under different shapes and forms as shown in Figure 3. Unicellular cyanobacteria have spherical or ovoid cells that are able to aggregate into colonies bounded by the mucous matrix secreted during its formation. After cell division, filamentous cyanobacterial cells remain adhered to each other and form a chain referred to as “trichomes”. The fragmentation of trichomes results in false branching with irregular branches, or sometimes in true branching when the cell division occurs perpendicularly (Mehdizadeh Allaf & Peerhossaini, 2022).
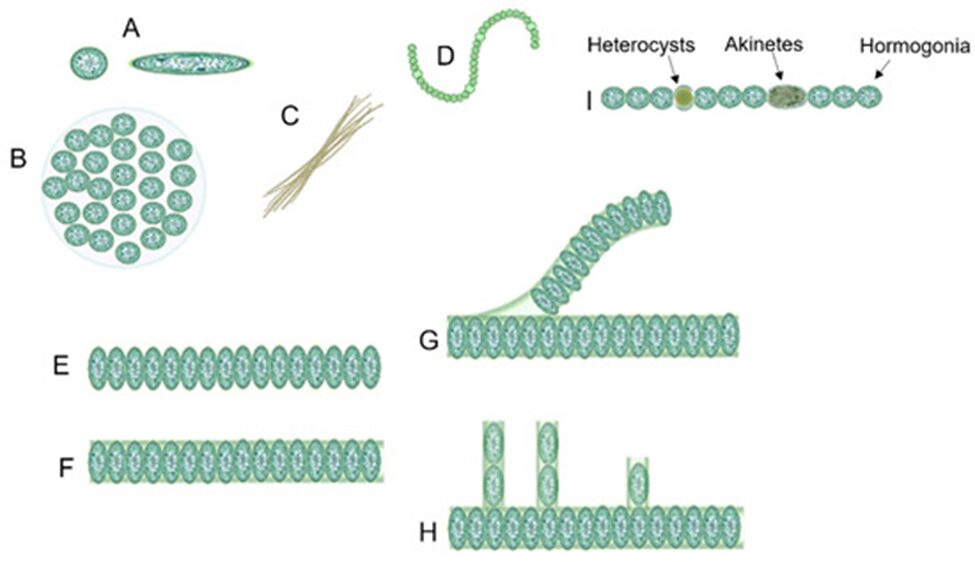
Figure 3. Diversity of cyanobacterial shapes: (A) spherical, (B) colonial, (C) filamentous, (D) spiral/helical, (E) unsheathed trichome, (F) sheathed trichome, (G) false branching, (H) true branching, (I) different cell types in filamentous cyanobacteria (Mehdizadeh Allaf & Peerhossaini, 2022).
Structural mechanics of filamentous cyanobacteria
An interesting morphological adaptation concerns the structural mechanics of cyanobacteria and is related to their physical ability to bend and to move on surfaces. Since many filamentous cyanobacterial species lack flagella or a physical form of locomotion, multiple theories are formulated around their gliding mechanisms. Theories suggesting that gliding motility in cyanobacteria is generated by the continuous secretion of polysaccharides or by the retraction of type IV pili are further explained in our paper focusing on the physical properties of cyanobacteria. Here, the prime focus is the movement of cyanobacteria associated with their geometry and shape fluctuations (Faluweki & Goehring, 2022).
Geometrical structure modelling
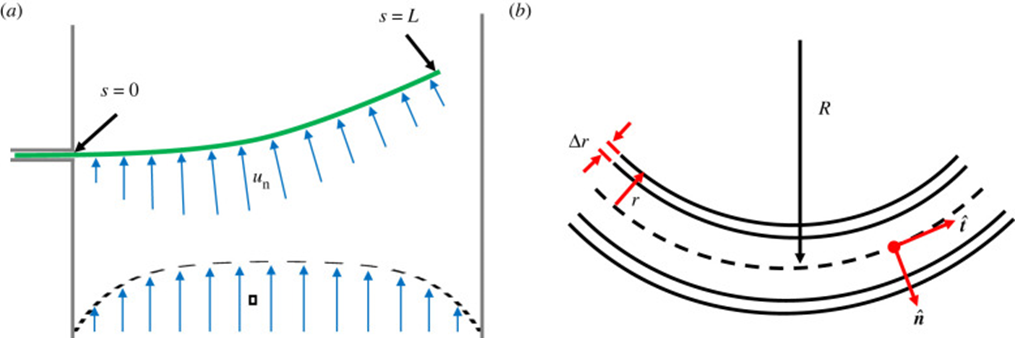
Geometrically, filamentous cyanobacteria can be considered to act as self-propelled, semi-flexible, and elastic rods. The shape of a strand of cyanobacteria is defined along an arc or contour length coordinate s by its position coordinate x. The normal vector n, the orientation  of the tangent vector t (Equation 5), the curvature k(s) (Equation 6), and the radius R(s) of the curvature (Equation 7) are the geometric variables that contribute to modelling the cyanobacterial structure as shown in Figure 4 (Faluweki & Goehring, 2022).


(Faluweki & Goehring, 2022)

Figure 4. Modelling of the geometrical structure of cyanobacteria. (a) The filament of bacteria is treated as a rod of length L exposed to bending forces un. (b) Close up the filament has a hollow cylindrical structure of radius r and wall thickness Dr (Faluweki & Goehring, 2022).
Curvature and gliding motility
The geometrical model explained above is applied to show that the gliding motility of cyanobacteria is affected by shape fluctuations. In an experiment, actively moving and inactive filamentous cyanobacteria of the O. lutea, K. animale, and L. lagerheimii species were examined under optimal conditions at approximately 20 °C and when chilled to reduce metabolism and mobility at around 2 °C respectively. They were characterized by looking at how their orientation  from the tangent vectors varies along their length s. The results showed that freely gliding filamentous cyanobacteria adopt a curved shape. Active filaments opt for a relatively constant curvature k (Figure 5.(a)) and form shapes that are well-approximated by circular arcs. Therefore, by fitting circles directly to the filament shapes, measuring their radius of curvature becomes an easy task (Figure 5.(b)) (Faluweki & Goehring, 2022).
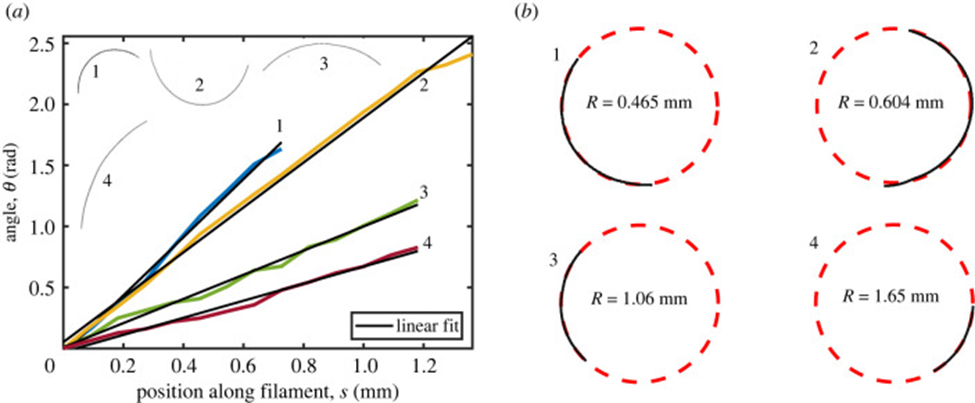
Figure 5. (a) Plot of the orientation angle versus the position along filament shapes of four typical cases of O. lutea corresponding to the profiles shown in the upper left. The linear fits explain that for each filament, the orientation angle has a constant rate of change and that therefore the shape has a constant curvature. (b) Curved configurations along with best fit circles and curvature radii for active gliding filamentous bacteria (Faluweki & Goehring, 2022).
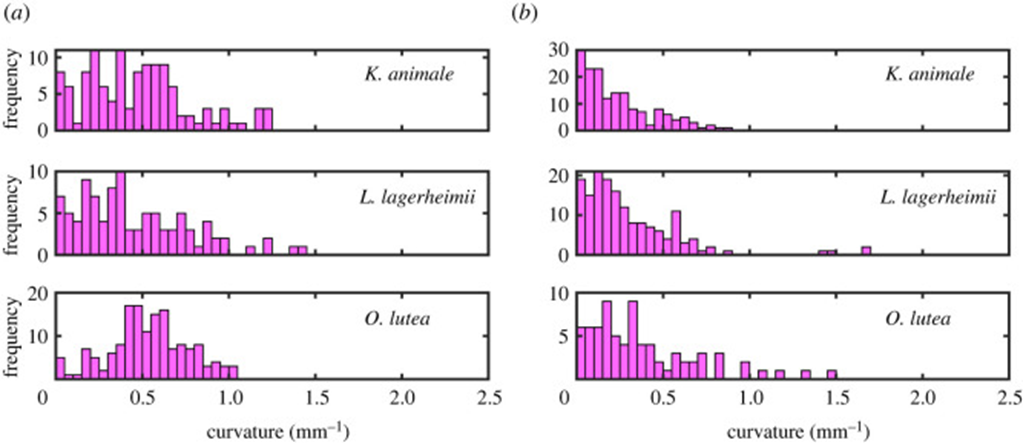
Furthermore, by comparing the curvature distributions for the active and inactive cases of all three species (Figure 6), it is noticeable that actively gliding members have a preferred curvature of around 0.5 mm-1 while the inactive filaments show an insignificant mean value surrounding 0.0 mm-1 for the curvature instead. On that account, it becomes clear that for the active case, internal cyanobacterial forces break the symmetry and generate the pattern of tension-compression required to maintain an appropriate shape during their movement activity. However, a deeper understanding of the chirality and symmetry of cyanobacteria’s structure is necessary to understand their motility mechanism better since a stronger yet still inexplicable preference for a clockwise motion is observed in all three species (Faluweki & Goehring, 2022).

Figure 6. Curvature distributions obtained from associating the filament shape of (a) active gliding and (b) inactive cyanobacteria to a circular arc of determined radius (Faluweki & Goehring, 2022).
An additional visual confirmation of this phenomenon is provided by Figure 7. Under ideal conditions, active gliding specimens of O. lutea appear as long thin curved filaments (Figure 7.(a)). However, when rendered inactive by being briefly cooled, the filaments adopt a more random and irregular shape (Figure 7.(b)). In summary, shape fluctuations effectively dictate the motility activation of cyanobacteria (Faluweki & Goehring, 2022).
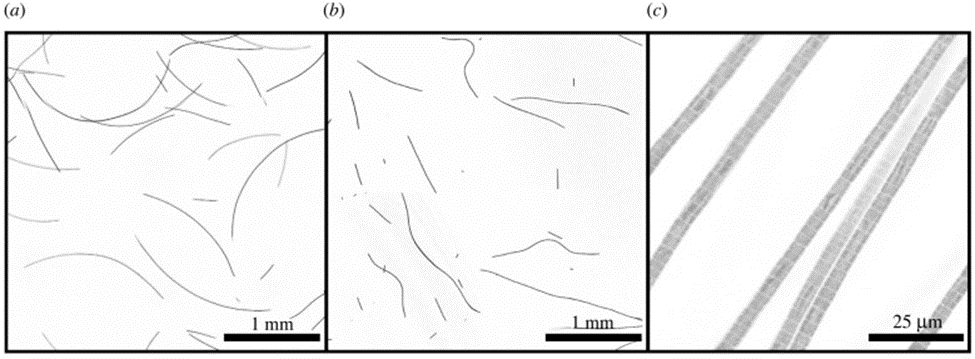
Figure 7. (a)Active gliding and (b) inactive filamentous cyanobacteria under confocal fluorescence imaging. (c) A higher magnification show that cyanobacterial filaments are trichomes composed of one-cell-wide strands of connected cells (Faluweki & Goehring, 2022).
Geometry modelling to quantify mechanical properties
This geometrical modelling is also utilized to describe the flexibility and rigidity of the cyanobacterial trichomes (Figure 3.(E) and (F)) and their resistance to environmental forces. By treating the cell wall as a thin, hollow cylinder of radius r, thickness Dr (with Dr <<< r), and Young’s modulus E, it will have a bending stiffness. The bending of a trichome means that both external forces and internal moments act to bend this elastic strand. Its mechanical resistance is therefore determined by its bending stiffness or flexural rigidity b (Equation 8). Physically, the bending indicates that one side of the filament, on the inside of the bend, is under compression, whereas the opposite side is in tension or extension (Faluweki & Goehring, 2022).

(Faluweki & Goehring, 2022)
Additionally, the bending stiffness obtained from the geometrical modelling is related to the persistence length Lp of the strand of cyanobacteria. In simple words, the persistence length of trichomes is a degree of bendiness, more precisely, the degree of fluctuation of local orientation along the length of the trichome resulting from natural deformation. It is proportional to the structure’s bending stiffness β and divided by the Boltzmann constant Kb multiplied by the absolute temperature of the system T (Equation 9). Length persistence is a convenient parameter since it can be simply obtained by optical inspection. It is a suitable indicator of the trichomes’ resistance to bending (Chaiyasitdhi et al., 2018).

(Chaiyasitdhi et al., 2018)
Impacts of morphology on stiffness and gliding motility
Based on the mechanical properties and on the geometrical modelling previously explained, two different shapes of the Arthrospira species are compared to determine how trichomes benefit from their particular morphology. Helical Arthrospira trichomes (Figure 3.(D)) and linear Arthrospira trichomes (Figure 3.(E) and (F)) each present a specific advantage when it comes to stiffness and gliding motility (Chaiyasitdhi et al., 2018).
By capturing images of the trichomes under a light microscope and calculating their persistence length Lp using a custom MATLAB script, an experiment showed that helical trichomes have a statistically significant greater Lp than linear trichomes through a t-test with a p-value lower than 0.001 which validates the significance of the difference between the median values of the two groups. This is what the boxplot in Figure 8.(A) indicates. The distributions of persistence length (Lp) of linear and helical trichomes are measured along their centers represented by the white dash lines on the left panel. The trichomes respectively present a median ± significant difference (SD) value of [2±3] x 103 mm and [37±58] x 103 mm reflecting this large contrast favouring helical Arthrospira. Keeping in mind that the persistence length is proportional to the bending stiffness which is itself proportional to the elasticity modulus E, the radius r and wall thickness Δr of the cyanobacterial strand, let’s look at Figure 8.(B). This second boxplot shows that there is no significant difference between the elastic moduli (E) of the linear and helical trichomes with respective mean ± SD values of [2.3 ± 0.5] MPa and [2.4 ± 0.5] MPa (Chaiyasitdhi et al., 2018).
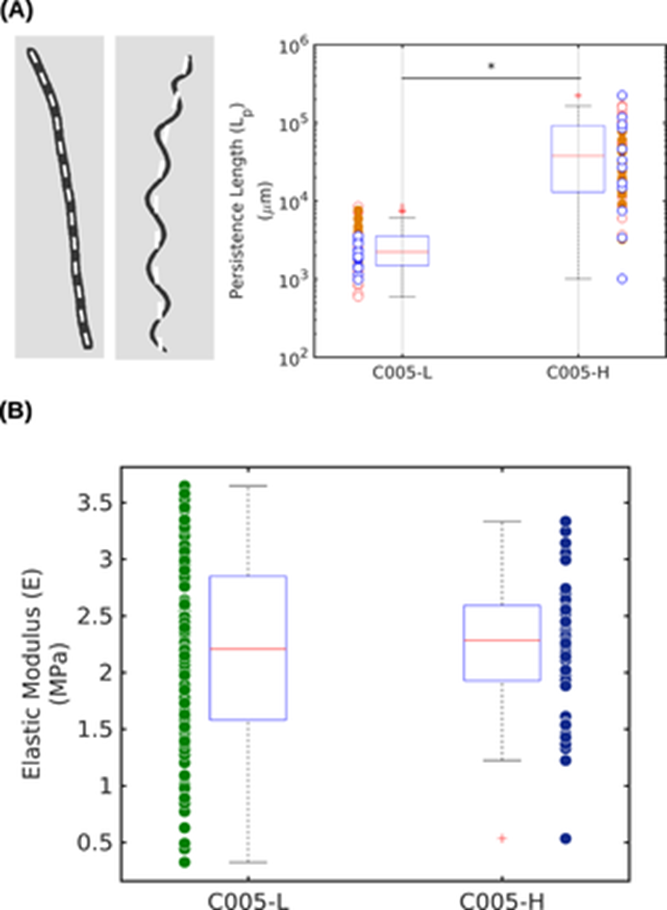
Figure 8. Statistical distributions of the (A) persistence length (Lp) and of the (B) elastic moduli (E) in linear (C005-L) and helical (C005-H) trichomes (Chaiyasitdhi et al., 2018).
Since the elastic modulus remains constant across linear and helical trichomes, it is implied that the radius r and wall thickness ∆r of helical trichomes, and therefore that the specific morphology of cyanobacteria is the main contributor to the higher Lp [3]. To confirm this, a 3D geometric model is designed using Arthrospira trichomes with varying helix radii (Rhelix) based on their structural parameters. It indicates that as Rhelix increases, the cross-section area of the trichome expands and moves away from the centroid thus increasing the bending stiffness β. Indeed, β increases from 0.07 x 10⁻¹⁶ N.m2 for Rhelix = 0 mm to 2.19 x 10⁻¹⁶ N.m2 for Rhelix = 15 mm (Figure 9) (Chaiyasitdhi et al., 2018).
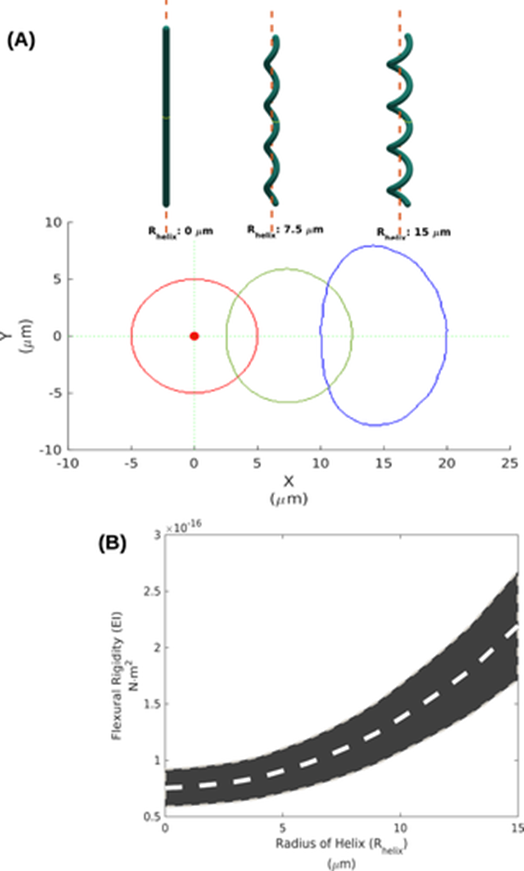
Figure 9. (A) The 3D geometric models of a straight trichome (Rhelix = 0 mm), and helical trichomes (Rhelix = 7.5 and 15 mm) and their cross-section. (B) The estimated bending stiffness b increases as Rhelix increases, with the gray stripe indicating the possible range of measurements (Chaiyasitdhi et al., 2018).
Overall, helical trichomes, compared to linear trichomes, have greater persistence lengths Lp by orders of magnitude. This property is also reflected by the increasing bending stiffness b. These two parameters indicate the contribution of morphology in increasing the stiffness and bending resistance of helical trichomes. This provides several biomechanical advantages and explains why the helical shape is the common form of Arthrospira in nature. An improved stiffness and flexibility allow helical Arthrospira to access nutrients more easily through advection and to obtain a structural strength without investing energy in additional strengthening mechanisms (Chaiyasitdhi et al., 2018).
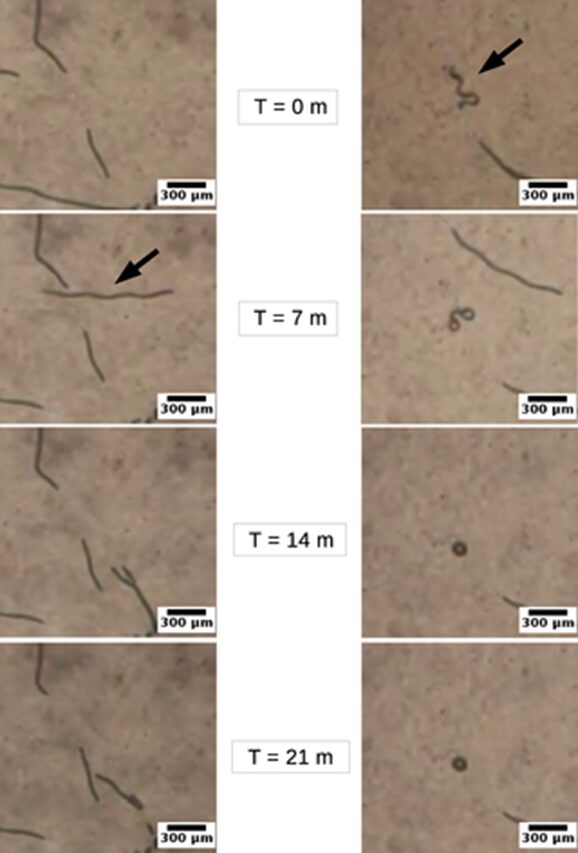
However, the morphological variants of the same cyanobacterium species exhibited significantly different gliding performances, this time advantaging shape linearity. In general, linear trichomes exhibit more elongated and straighter trajectories as shown in Figure 10. They can even move back and forth occasionally, and their improved directionality allows them to make snap turns at any random moment. On the contrary, helical trichomes fail to maintain directionality in their movement and tend to twist around their starting point which even leads to the deformation of their helix. In addition, linear trichomes benefit from a better gliding speed of 0.01 to 0.37 μm/s compared to the speed of helical trichomes which ranges between 0.00 and 0.12 μm/s (Chaiyasitdhi et al., 2018). Therefore, linearization is a strategy employed by cyanobacteria to improve their gliding motility and their migration capability. When they encounter stressful conditions such as drought, starvation, and hostile environmental forces, linear trichomes improves their gliding efficiency to escape and preserve the population species.

Figure 10. Images taken at t = 0, 7, 14, and 21 minutes respectively showing that linear Arthrospira trichomes (left panel) move for a longer distance while helical trichomes (right panel) remain near their initial positions (Chaiyasitdhi et al., 2018).
In summary, the morphology of cyanobacteria can be represented by a simple geometrical model comparing the strands of bacteria to flexible hollow cylinders. Geometry is then used to assess the morphological adaptations of cyanobacteria. Their shape curvature promotes their gliding motility mechanism. Their morphological variety also advantages specific functions. While helical cyanobacterial trichomes are characterized by a stronger flexibility and bending resistance, linear ones benefit from a better gliding motility. We have now seen the advantages that mathematics provide to cyanobacterial colonies and to cyanobacteria themselves. What about the organelles of cyanobacterial cells? Their intricate structures and mechanisms are also attributable to the benefits of geometry!
STRUCTURE OF CARBOXYSOMES AND THEIR ROLE IN CO2 CONCENTRATING MECHANISM
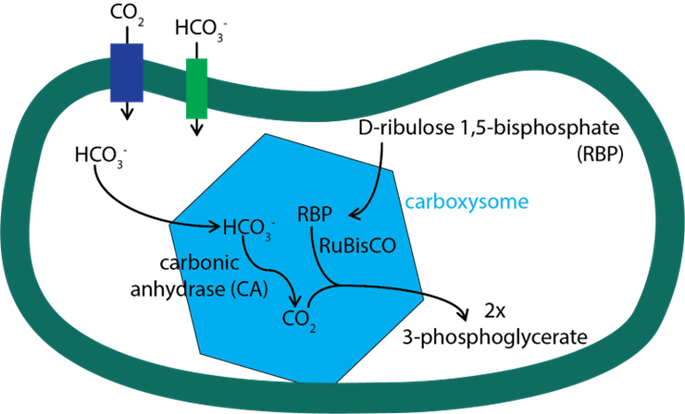
Cyanobacteria living in marine environments face the problem of a limiting level of CO2 for their Rubisco, which is the first enzyme in the photosynthetic carbon reduction cycle to carry out photosynthesis in a sufficient level. To acclimate to this environment, cyanobacteria have evolved a CO2 concentrating mechanism. This mechanism incorporates two major components: 1. the inorganic carbon (Ci) uptake systems to either actively transport HCO3– into the cell or convert the CO2 that passively enters the cell into HCO3–; 2. the specialized microcompartment called carboxysome. The uptake of inorganic carbon results in the accumulation of HCO3– in the thylakoid of cyanobacteria. Then, the HCO3– would diffuse into carboxysome, be converted into CO2, and be used by RuBisCO to carry out the first step photosynthetic carbon reduction (PCR) cycle forming 3-phosphoglyceric acid (Figure 11) (Rae et al., 2013).

Figure 11. Major steps of CO2 concentrating mechanism (Bonacci et al., 2012).
As a noncharged hydrophobic molecule, CO2 is very likely to leak out from the lipid membrane of cyanobacteria, and that is why the first step of PCR cycle must be carried out in carboxysome. The shell of this microcompartment is tightly composed by protein but not lipid, so it is able to minimize the leakage of CO2 out of carboxysome. However, as shown in Figure 11, there are other molecules that need to entry carboxysome (HCO3–, ribulose 1,5-bisphosphate) or depart from carboxysome (3-phosphoglycerate). If the shell proteins are compacted so tightly, how does it enable the pass of these molecules across the shell? The answer lies in the structure of these shell protein and the geometry of their oligomers. The following section will focus on the geometry of carboxysome, the formation of this special structure, and the relationship between its structure and function.
Composition of the polyhedral structured shell
There are two types of carboxysomes present in cyanobacteria, namely the α-carboxysomes and the β-carboxysomes, with the former present mainly in oceanic strain, whereas the latter are found in freshwater and estuarine spp. These two carboxysome forms appear to have arisen by parallel evolution, although some of the small carboxysome shell proteins are clearly related. Their shells also possess the same general structure (Figure 12) (Rae et al., 2013).
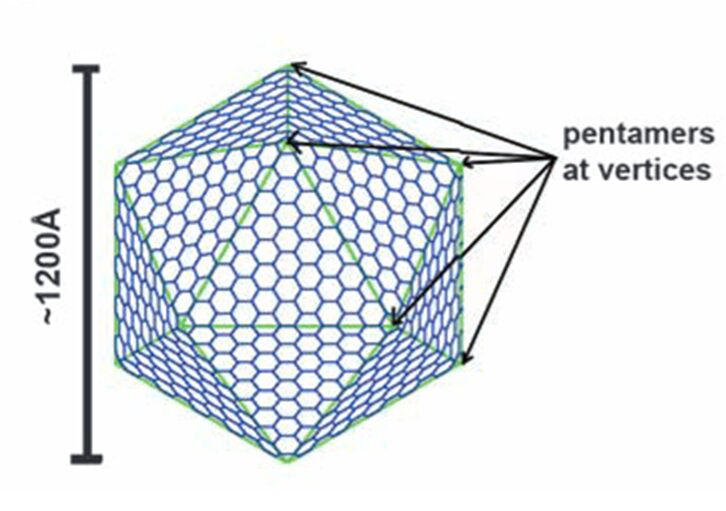
Figure 12. A diagram showing the construction of a large icosahedron from many smaller hexagons and 12 pentagons at the vertices (Tanaka et al., 2008).
Carboxysome’s shell has an icosahedral structure that is composed of the flat hexagonal sheets forming the flat facets and the curved pentagonal sheets occupying the vertices of this icosahedral shell. The hexagonal sheets of carboxysome shell are composed predominantly of CsoS1 proteins (homologousproteins CsoS1A, B, and C) in Halothiobacillus neapolitanus (H. neapolitanus, a chemoautotroph containing α-carboxysomes) and of CcmK proteins (homologous proteins CcmK1 to 4) in Synechocystissp. strain PCC (PasteurCulture Collection) 6803 (Syn. 6803, a cyanobacterium containing β-carboxysomes). Since the way they compose and function are quite similar, this part of the essay only explains the structure and function of CsoS1 proteins (Rae et al., 2013).
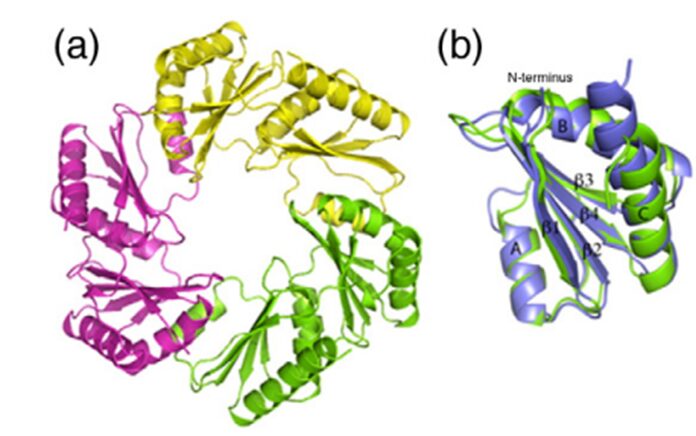
All CsoS1 proteins are small, 10- to 11-kDa protein. Briefly, crystal structures of the CsoS1A, CsoS1C, andCsoS1D proteins have been elucidated, showing that these proteins contain in the characteristic bacterial microcompartment (BMC) domain and form flattened, regularly hexagonal hexamers (CsoS1A and -C) shown in Figure 13 or trimers (CsoS1D) shown in figure 14 (Rae et al., 2013).

Figure 13. (A) A ribbon diagram with the monomeric units colored alternately in purple and teal. (B) A close-up of the CsoS1A monomer in the hexamer. Secondary structures are labeled and numbered (Tsai et al., 2007).

Figure 14. (a) The CsoS1D trimer. (b) Superposition of the N-BMC (green) and C-BMC (blue) domain structures of CsoS1D (Klein et al., 2009).
Based on the different conformation of their oligomers, the mechanisms that are used by these proteins to generate the special selective permeability are also different.
Structure of CsoS1A: possible pass way for small negatively charged molecules
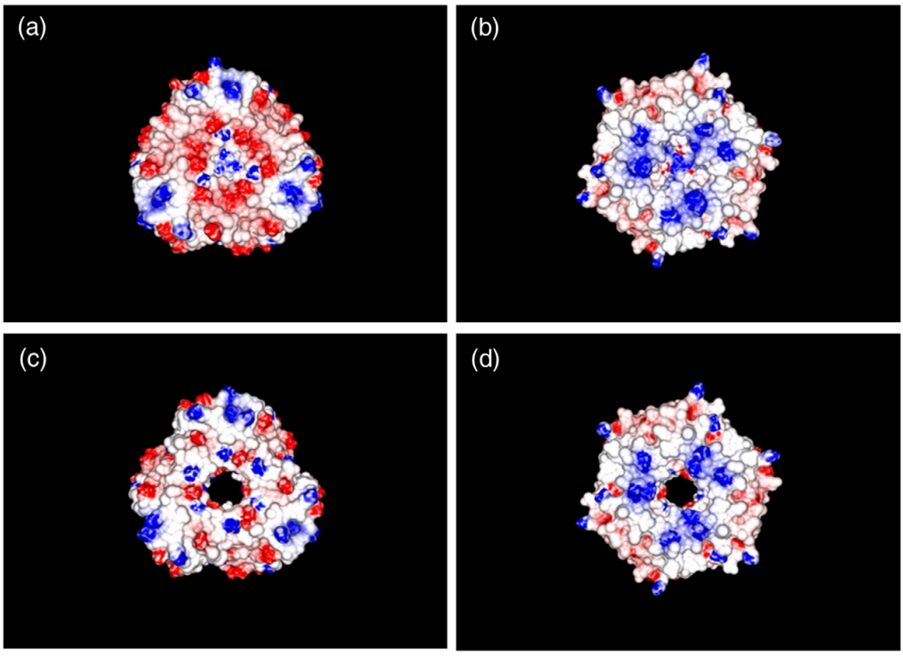
The exact mechanism for the selective permeability of shells formed by CsoS1 has not been established experimentally. The proposed mechanism for selective permeability of the shell relates to the presence of a conserved charged pore at the 6-fold axis of symmetry in the CsoS1A and CsoS1C oligomers studied to date. The pore at the center of the CsoS1A hexamer is approximately 4 Å across at its narrowest point. This situation arises from a major depression at the center of the hexamer on one of its faces, and a minor depression on the other side. As a result, the two sides of the hexamer have different shapes, with one side appearing to be strongly concave and the other being more nearly convex (Figure 15). The pore is lined by positively charged residue and thus is proposed to be able to bind and promote the passage of small negative charged particles such as HCO3–, ribulose-1,5-bisphosphate (RuBP), and 3-phosphoglycerat across the carboxysome shell (Tsai et al., 2007).
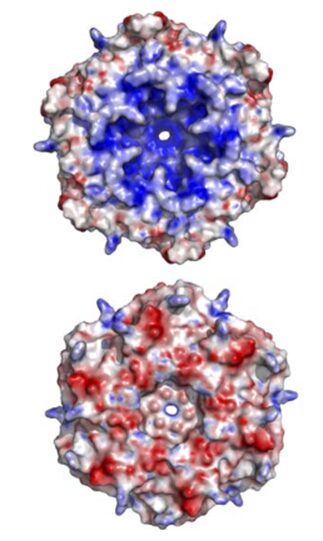
Figure 15. An illustration of the geometric and electrostatic differences between the concave (top) and convex (bottom) sides of the CsoS1A hexamer. The concave side of CsoS1A is composed of mostly positive electrostatic potential (blue), whereas the convex side is composed of mostly negative electrostatic potential (red) (Tsai et al., 2007).
CsoS1D: gate for diffusion of comparatively larger molecules
The oligomer shown in figure 14a seems to be a hexamer too, but it is actually a trimer. CsoS1D is composed of a tandem pair of BMC domains: N-terminal BMC (N-BMC) and C-terminal BMC (C-BMC). Their differences are shown in figure 3B. Overall, the fold of the N-BMC and C-BMC of CsoS1D is very similar to those of the single-BMC domain proteins (CsoS1A) that have been structurally characterized. What different is that two trimers of CsoS1D would subsequently bind together to form a dimer of trimer or pseudohexamer. The two trimers in the pseudohexamer were found to be in substantially different conformations (figure 16). In one trimer, Arg121 and Glu120 side chains are oriented to leave a pore of ~ 14 Å at the 3- fold axis of symmetry (Figure 16.(c) and (d)); we refer to this trimer as the open trimer. In contrast, in the other, “closed” trimer, each CsoS1D monomer’s Glu120 side chain forms a salt bridge with Arg121 of the adjacent monomer, effectively closing the pore (Figure 16.(a) and (b)). Comparing the 4 Å pore of CsoS1A, this larger pore may be advantageous for the diffusion of the bulkier carboxysome metabolites (e.g., RuBP), which would be expected to pass through the CsoS1A pores only with difficulty (Klein et al., 2009).

Figure 16. Electrostatic surface representation of the (a and b) closed CsoS1D trimer and the (c and d) open CsoS1D trimer. The surfaces shown in (a) and (c) are exposed to solvent in the crystal; those in (b) and (d) are involved in the dimerization of the open and closed trimer. Figures are colored according to electrostatic potential with blue positive and red negative (Klein et al., 2009).
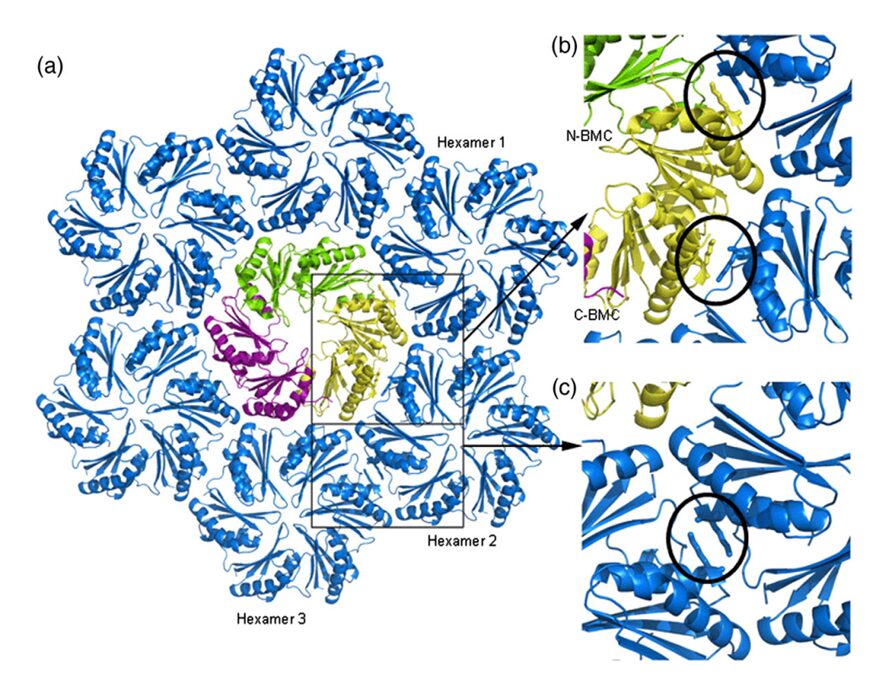
The hexamers (e.g.CsoS1A) and pseudohexamers (e.g.CsoS1D) fits together tightly with the complementary edges of other hexamers to form a flat molecular layer (figure 17 and 18). The combination of their complementary selective permeabilities result in the selective permeabilities of carboxysome shell (Klein et al., 2009).
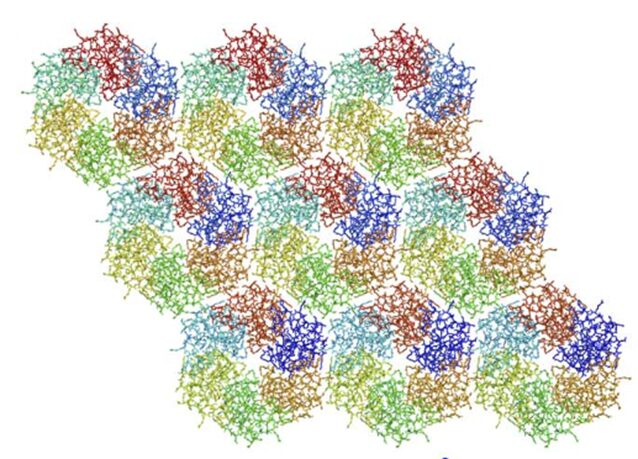
Figure 17. Individual CsoS1A molecules are colored differently in each hexamer. CsoS1A molecules in the same hexameric position are colored the same (Tsai et al., 2007).

Figure 18. (a) Model of the interaction of the closed CsoS1D trimer (colored as in Fig. 3a) and a layer of CsoS1 hexamers (blue). A single CsoS1D monomer interacts with three CsoS1 hexamers, labeled in reference to the interface analysis reported in Table 1. (b and c) Close-up views of the conserved Lys side chains (circled) at the intermolecular interface of adjacent BMC domains between CsoS1D and CsoS1 (b) and between adjacent CsoS1 hexamers (c) (Klein et al., 2009).
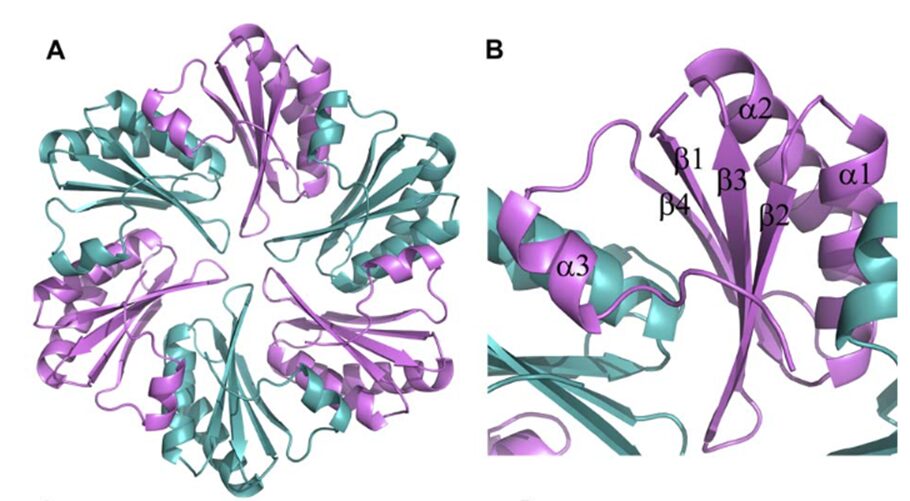
Pentamers at vertices
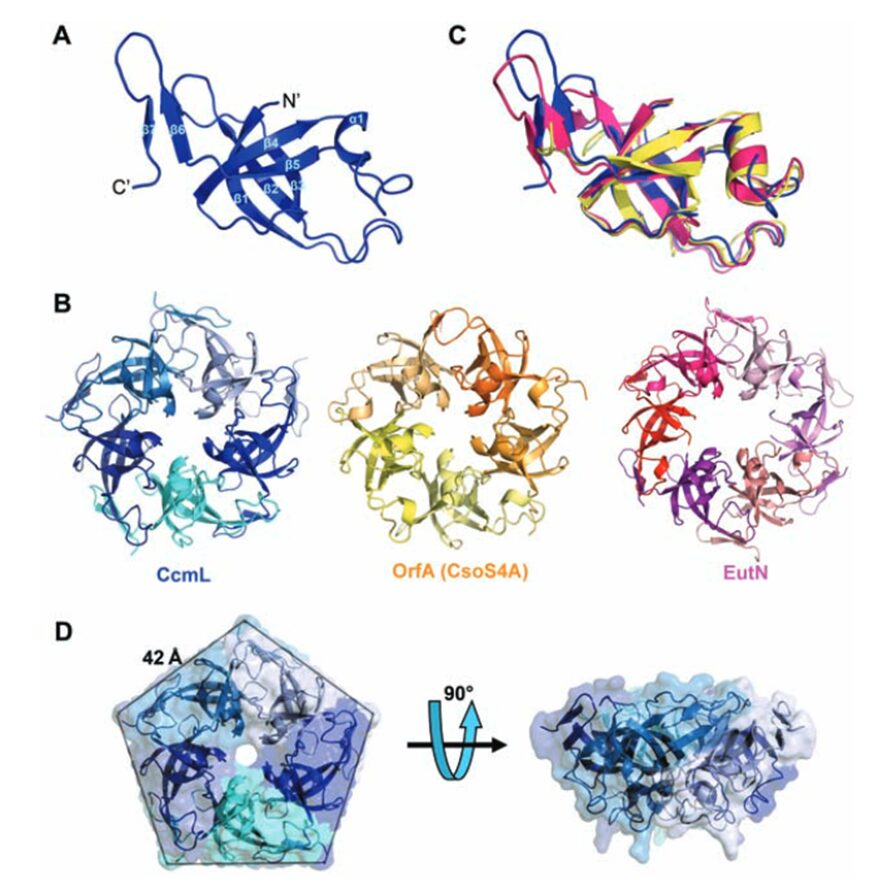
As previously mentioned, the icosahedral geometry of carboxysomes requires a unique structural element to completely close the carboxysome shell at the 5-fold axes of symmetry—the vertices (Figure 11). This pentameric unit is composed of OrfA (or CsoS4A) protein in H. neapolitanus and CcmL protein in Syn. 6803. The structures of CcmL and OrfA are highly similar. Both CcmL and OrfA formed symmetric pentamers in their respective crystal structures (Figure 19). The individual subunits of the pentamers are held tightly together by their protruding C-terminal regions, which form extensive interactions with neighbouring subunits. The large subunit interfaces and the structural agreement between the two proteins argue that the observed pentameric structures represent their natural biological forms. The subunits are packed tightly around the axis of symmetry, leaving only a narrow pore through the center, with a diameter of ~5 Å in CcmL and ~3.5 Å in OrfA. The tight packing of those shell subunits has been proposed to limit movement of substrates and products into and out of the carboxysome (Tanaka et al., 2008).

Figure 19. Crystal structures of the carboxysome proteins CcmL and OrfA revealing pentagonal symmetry. (A) Structure of the CcmL monomer from Syn.6803. (B) A comparison of similar structures: CcmL (blue), OrfA (or CsoS4A) from H. neapolitanus (yellow), and EutN from E. coli(pink) (PDB 2Z9H). The RMSD between the protein backbones of CcmL and OrfA is 1.0 Å, and 1.3 Å between CcmL and EutN. (C) CcmL and OrfA assemble as natural pentamers. EutN, which is part of the eut operon that encodes proteins presumed to comprise the distinct eut microcompartment in E. coli,isinsteadhexameric. (D) Top and side views of the CcmL pentamer showing a pentagonal disk with slanted sides (Tanaka et al., 2008).
The size and shape of the CcmL and OrfA pentamers make them suitable to generate curvature by being inserted into the hexagonally packed molecular layers previously elucidated for the carboxysome shell (Figure 20) (Tanaka et al., 2008).
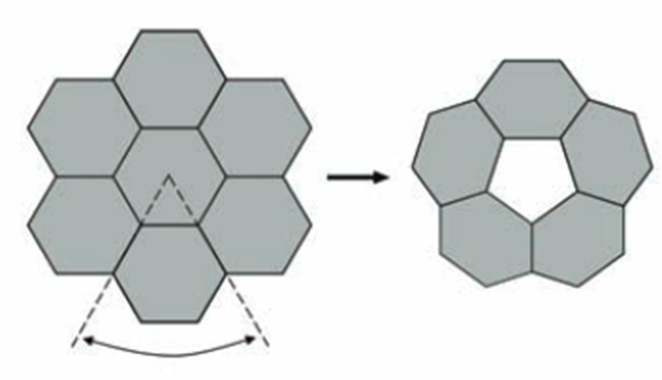
Figure 20. A flat layer of hexagons can be folded to give pentagonal vertices by removing one sector at each vertex. Twelve such vertices are present in an icosahedral shell (Tanaka et al., 2008).
Overall structure of carboxysome
Knowing the structures of both the hexametric and pentameric components of the carboxysome, it is possible to model the architecture of the complete shell. As shown in Figure 21, the carboxysome shell are composed by twenty fattened triangular facets formed by tightly compacted shell protein hexamers and pseudohexamers and twelve shell protein pentamers at each vertice (Tanaka et al., 2008).
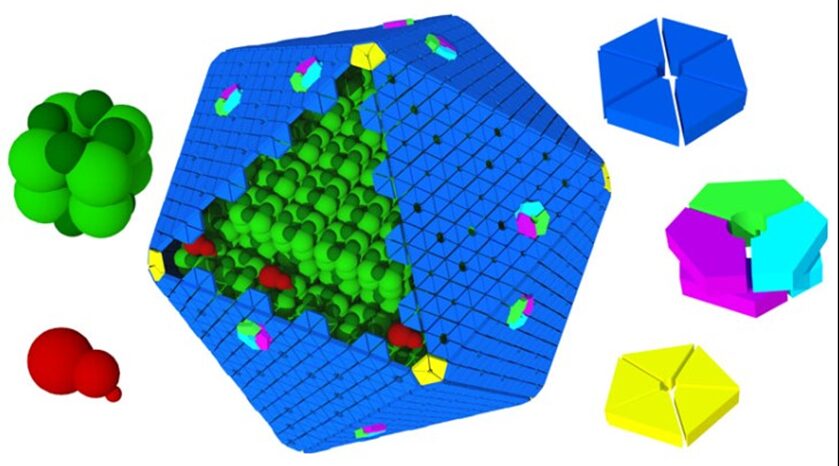
Figure 21. Schematic model of the α-carboxysome assembly containing RuBisCO small (dark green) and large (green) subunits and carbonic anhydrase (red). The shell is composed of hexamers (blue), pseudohexamers (light blue, magenta, and light green), and pentamers (yellow) (Bonacci et al., 2012).
Now, the answer to the special selective permeability of carboxysome’s shell is clear: the protein hexamers and pseudohexamers are tightly packed with each other and with the shell protein pentamers to block the diffusion of CO2 across the shell; the small pore at the centre of each shell protein pentamer allows the diffusion of small negatively charged particles (e.g.HCO3–); the gated pore at the centre of each shell protein pseudohexamer ease the diffusion of bulkier molecules (e.g.RuBP).
CONCLUSION
In conclusion, mathematical models and geometry principles can be applied to cyanobacteria to describe how these organisms are naturally designed to find solutions for avoiding predation, achieving more efficient growth rates, increasing their access to nutrients, regulating energy use and synthesis, and developing structural strength.
The mathematical exploration of cyanobacteria’s morphology reveals a delicate correlation between geometry and functionality. Cyanobacteria’s gliding motility is influenced by shape fluctuations. The importance of curvature patterns is showcased to enhance their motility mechanism. The relationship between bending stiffness and persistence length also highlights the adaptability of cyanobacteria. Depending on their needs and surroundings, they undergo morphological changes from which they can benefit in different situations. When they want to improve their gliding motility in order to avoid harsh environmental conditions and preserve their population, filamentous cyanobacteria trichomes opt for linearity. However, when they need to increase their flexibility to facilitate nutrient intake, cyanobacteria adopt a helical shape.
Instead of allocating resources to intricate cell structures, they have showcased expertise in generating varied morphologies by strategically employing colonization. This significantly contributes to maintaining an enhanced surface-to-volume ratio. This adaptation allows for an increase in nutrient uptake without needing to increase in size, therefore decreasing growth rate. Furthermore, cyanobacteria have evolved a defence mechanism against predation in which they can sense the chemical signals of a predator and respond by producing more colonies.
Finally, carboxysome as the last component of CCM is required to have a tightly packed shell to block the leakage of CO2. Although the shell hexamers and pseudohexamers can tightly bind to each other to form a flattened facet, the shell has pentagonal shaped gaps at vertices that may lead to the leakage of CO2. To fully close the gap, cyanobacteria designed a different protein from the shell protein used to form hexagonal sheet that is able to form a pentamer with a pentagonal shape. The size and shape of the pentamers make them suitable to generate curvature by being inserted into the hexagonally packed molecular layers to perfectly cover the gap and minimize the leakage of CO2.
Indeed, mathematical models serve as indispensable instruments for the examination of biological systems. Greater understanding of cyanobacterial growth and morphology can improve management of their blooms to better protect drinking water and biodiversity, as well as for applications in engineering such as carbon capture, the prevention of eutrophication, bioremediation, and biofuel production.
References
Bonacci, W., Teng, P. K., Afonso, B., Niederholtmeyer, H., Grob, P., Silver, P. A., & Savage, D. F. (2012). Modularity of a carbon-fixing protein organelle. Proceedings of the National Academy of Sciences, 109(2), 478-483.
Borics, G., Várbíró, G., Falucskai, J., Végvári, Z., T-Krasznai, E., Görgényi, J., B-Béres, V., & Lerf, V. (2023). A two-dimensional morphospace for cyanobacteria and microalgae: Morphological diversity, evolutionary relatedness, and size constraints. Freshwater Biology, 68(1), 115-126. https://doi.org/https://doi.org/10.1111/fwb.14013
Castenholz, R. W. (2015). General characteristics of the cyanobacteria. Bergey’s Manual of Systematics of Archaea and Bacteria, 1-23.
Chaiyasitdhi, A., Miphonpanyatawichok, W., Riehle, M. O., Phatthanakun, R., Surareungchai, W., Kundhikanjana, W., & Kuntanawat, P. (2018). The biomechanical role of overall-shape transformation in a primitive multicellular organism: A case study of dimorphism in the filamentous cyanobacterium Arthrospira platensis. PLOS ONE. https://doi.org/https://doi.org/10.1371/journal.pone.0196383
Faluweki, M. K., & Goehring, L. (2022). Structural mechanics of filamentous cyanobacteria. J R Soc Interface, 19(192), 20220268. https://doi.org/10.1098/rsif.2022.0268
Ji, X., Verspagen, J. M. H., Van de Waal, D. B., Rost, B., & Huisman, J. (2020). Phenotypic plasticity of carbon fixation stimulates cyanobacterial blooms at elevated CO(2). Sci Adv, 6(8), eaax2926. https://doi.org/10.1126/sciadv.aax2926
Kinney, J. N., Axen, S. D., & Kerfeld, C. A. (2011). Comparative analysis of carboxysome shell proteins. Photosynthesis Research, 109, 21-32. https://doi.org/10.1007/s11120-011-9624-6.
Klein, M. G., Zwart, P., Bagby, S. C., Cai, F., Chisholm, S. W., Heinhorst, S., Cannon, G. C., & Kerfeld, C. A. (2009). Identification and structural analysis of a novel carboxysome shell protein with implications for metabolite transport. Journal of molecular biology, 392(2), 319-333. doi:10.1016/j.jmb.2009.03.056
Kong, Z. Y. F. (2012). Formation of large colonies: a defense mechanism of Microcystis aeruginosa under continuous grazing pressure by flagellate Ochromonas sp. Journal of Limnology, 71. https://doi.org/10.4081/jlimnol.2012.e5
Mehdizadeh Allaf, M., & Peerhossaini, H. (2022). Cyanobacteria: Model Microorganisms and Beyond. Microorganisms, 10(4), 696. https://www.mdpi.com/2076-2607/10/4/696
Nielsen, S. L. (2006). Size-dependent growth rates in eukaryotic and prokaryotic algae exemplified by green algae and cyanobacteria: comparisons between unicells and colonial growth forms. Journal of Plankton Research, 28(5), 489-498. https://doi.org/10.1093/plankt/fbi134
Rae, B. D., Long, B. M., Badger, M. R., & Price, G. D. (2013). Functions, compositions, and evolution of the two types of carboxysomes: polyhedral microcompartments that facilitate CO2 fixation in cyanobacteria and some proteobacteria. Microbiology and Molecular Biology Reviews, 77(3), 357-379. https://doi.org/10.1128/mmbr.00061-12
Ranjbar, M. H., Hamilton, D. P., Etemad-Shahidi, A., & Helfer, F. (2021). Individual-based modelling of cyanobacteria blooms: Physical and physiological processes. Science of The Total Environment, 792, 148418. https://doi.org/https://doi.org/10.1016/j.scitotenv.2021.148418
Serizawa, H., Amemiya, T., Enomoto, T., Rossberg, A. G., & Itoh, K. (2008). Mathematical modeling of colony formation in algal blooms: phenotypic plasticity in cyanobacteria. Ecological Research, 23(5), 841-850. https://doi.org/10.1007/s11284-007-0447-z
Serizawa, H., Amemiya, T., & Itoh, K. (2009). Patchiness and bistability in the comprehensive cyanobacterial model (CCM). Ecological Modelling, 220(6), 764-773. https://doi.org/https://doi.org/10.1016/j.ecolmodel.2008.12.015
Tanaka, S., Kerfeld, C. A., Sawaya, M. R., Cai, F., Heinhorst, S., Cannon, G. C., & Yeates, T. O. (2008). Atomic-level models of the bacterial carboxysome shell. Science, 319(5866), 1083-1086. DOI:10.1126/science.1151458
Tsai, Y., Sawaya, M. R., Cannon, G. C., Cai, F., Williams, E. B., Heinhorst, S., Kerfeld, C. A., & Yeates, T. O. (2007). Structural analysis of CsoS1A and the protein shell of the Halothiobacillus neapolitanus carboxysome. PLoS biology, 5(6), e144. https://doi.org/10.1371/journal.pbio.0050144