Abstract
This essay analyses an assortment of animal homes and the way they are constructed, maintained, and affected due to the environment that surrounds them. Since the usage of a refuge has been moulded by the evolution of animals in their original environment, recurring patterns can be observed when analyzing these homes that are quantifiable by different mathematical models. Adaptations to specific environments are not random, and they have a significant impact on the characteristics of the homes. Each section in the following paper will cover different mathematical models that quantify coordination, networking or patterns pertaining to the following animal homes: ant hills, coral reefs and mole-rat burrows.
Introduction
All animals have a unique environment that they inhabit, and many of them have a common characteristic that they share: a home that enables them to seek refuge from predators or harsh environmental conditions. Without this refuge, they would be unable to defend themselves against a variety of threats. As each area is distinctive to a particular species, different animals have adapted differently to construct an efficient shelter to their distinct needs in the place where they originate. Therefore, these adaptations throughout each animal’s evolution, whether they are structural, behavioural, or physiological, have shaped an ideal way to construct their home, which in turn cause patterns to arise during the creation of their domicile.
These designs are a systematic way of being able to build the necessary home in the most efficient way. Mathematical analysis into the patterns will be done to attempt to explain the effects of these recurring arrangements on a selection of animal homes: ant hills, coral reefs, and mole-rat burrows. In the following sections, several patterns and mathematical descriptions of the previously mentioned homes will be presented and discussed.
Anthills
Despite their small stature, one look at the structures they build is enough to deduce that ants are some of the most brilliant creatures on the planet. These social Hymenoptera are distinguished by the colonies they form, which have surprisingly advanced schemes for labor division and coordination. In fact, the nest-building process undertaken by these insects relies heavily on this cooperation, and both dictates and is dictated by their behavioral patterns.
Anthills are typically structures primarily made of soil, which consist of a network of interconnected tunnels and chambers. As with most animal-built structures, anthills vary vastly from one ant species to the next. However, there exist a few mathematical models that can be used to generally explain different aspects of ant nest building. The following sections will delve into the mathematical reasoning that influences the patterns employed by ants while constructing their homes (Goryunov, 2015).
Territory Size
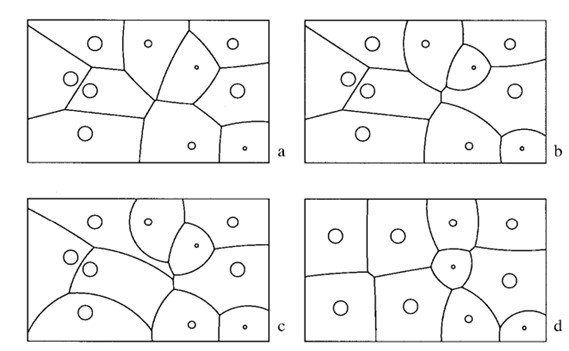
In order to start constructing anthills, the insects first need to establish the boundaries of their territories. Most commonly, these limits are determined by a set of factors including the aggression of the species, the biomass in the environment, and the presence of specific organisms. This is evident in Solenopsis invicta, a type of fire ants with notable aggressive tendencies. In general, an examination of this population would lead to the following relations: aggressive pressure exerted by the ants at the boundary of their territory is directly proportional to the biomass, but is inversely proportional to the total area of the territory and the square root of the distance from the colony (Adams, 1998). The most ideal method of modelling this system is using the formula:
P_{R}=\frac{CM_{R}}{A_{R}d_{R}^{y}}where PR is the pressure exerted by a resident of the colony, C is a constant, MR is the total biomass of said resident, AR is the total area of its territory, dR is the distance from its nest to the point of application, and y is the rate-determining factor for the decrease in pressure over distance. This formula can then be used to adequately describe the varying territory sizes in ant colonies, as that factor is directly dependent on the pressure applied by the residents of the anthill. This is illustrated in Figure 1, as it models boundaries between ant territories based on different aggressive pressure formulas. The noticeable difference can be attributed to major effect of the aforementioned factor on territory size (Adams, 1998).
Decentralized Coordination
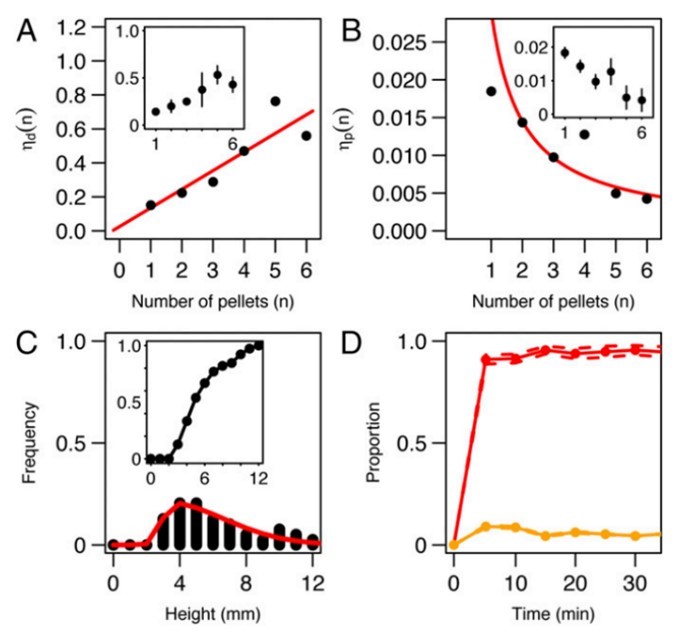
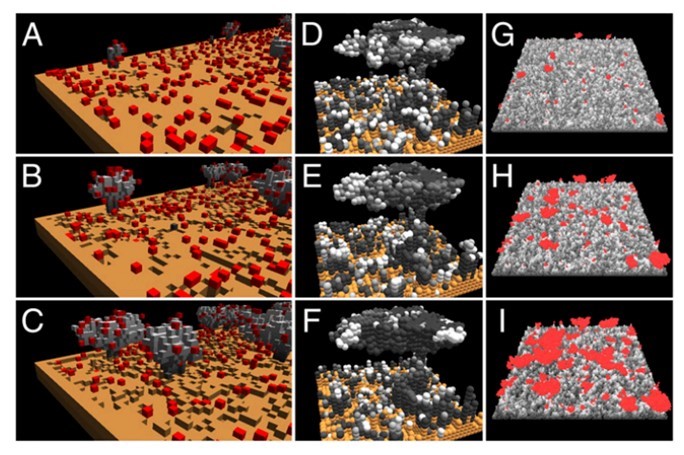
Once the territory has been established, ants have a complex system that relies on coordination to ensure the success of the nest building process. These insects are distinguished by their ability to adapt the plastic structures they build to changing factors, such as an increase in population, without being centrally coordinated. Instead, the necessary exchanges can be classified into two main subcategories: stigmergy and pheromone deposition for pillar-building, and template-based interactions to dictate the shift from pillar to roof construction. The former implies that the positioning of certain pellets of building material in a particular spot encourages other ants to do the same, which in turn triggers the same behavior in more members of the colony. This virtuous circle is mostly how the Hymenoptera coordinate amongst each other while making or expanding anthills. The mathematical reasoning behind this process is outlined in Figure 2. Figure 3 provides a simulation of the construction. The tendencies of individual ants have a direct impact on the behavior of the colony as a whole, which then affects the dynamics of the resultant structure, as well as the pattern formation in the nest (Khuong et al., 2016).
Pattern Formation
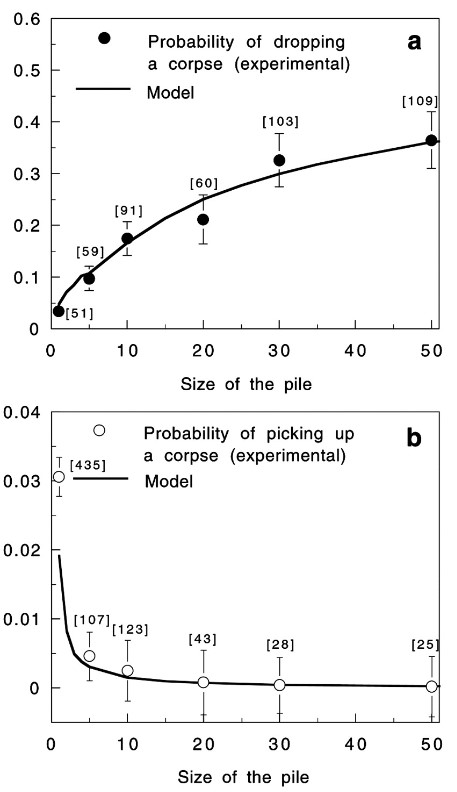
The patterns undertaken by ants while constructing are not only essential steps in the anthill-making process, but also some of the most fascinating dispositions found in nature. Generally, these patterns can be described as local activation–long range inhibition (LALI) mechanisms and are used by the social insects to build their nests. This mechanism is easily observable in a specific part of the hill construction: the assembly of cemeteries. The “activator-substrate” LALI model exhibits a pattern of clustering behavior, triggered by individual actions but observable on the collective scale. It is interesting to note the contrast between the probabilities of picking up or depositing corpses (Fig. 4), compared to the probabilities of picking up or depositing pellets (Fig. 2). These trends establish the fact that despite having no centralized coordination, ants have alternative ways of communicating to form patterns, and that these patterns vary depending on the needs of the colony (Theraulaz et al., 2002).
Despite their small size, ants are capable of building large anthills with extremely fine-tuned social coordination. These insects have understood the principle of strength in numbers and the power of teamwork. To find another habitat where a diverse group of animals rely on each other for survival, one must not look further than coral reefs.
Coral reefs
Reef-building corals, also known as hermatypic or hard corals, are marine invertebrates that form compact colonies consist of many individual polyps. These coral polyps secrete layers of calcium carbonate that act as the foundation and home for corals. Altogether, the layers of calcium carbonate form the coral reefs (Salcedo-Sanz, 2016).
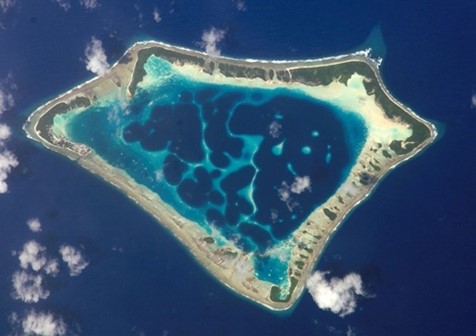
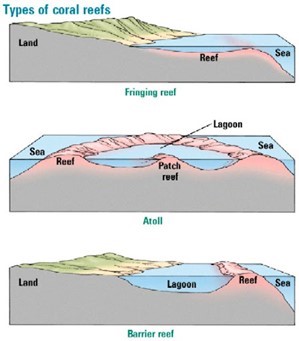
Coral reefs are some of the world’s most diverse ecosystems. There are three major characteristic forms — fringing (Fig. 5), barrier (Fig. 6), or atoll (Fig. 7). Moreover, in terms of ecosystems, there are shallow-water reef ecosystems which include hundreds of diverse species, such as the Northwest Hawaiian Island coral reefs. There are also less common deep-sea reef-building corals, that consist of only six species (Salcedo-Sanz, 2016). This diverse group of reef-building corals are excellent mathematicians. Their structures can be well analyzed with mathematics. Moreover, coral reefs are brilliant examples of hyperbolic space. The following sections will delve into the mathematical reasoning behind the shape and patterns of coral reefs, as well as the detailed construction of these brilliant structures.
Formation of Coral Reefs
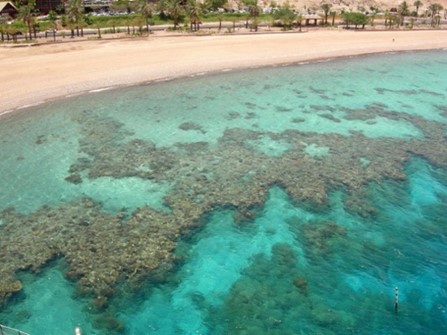
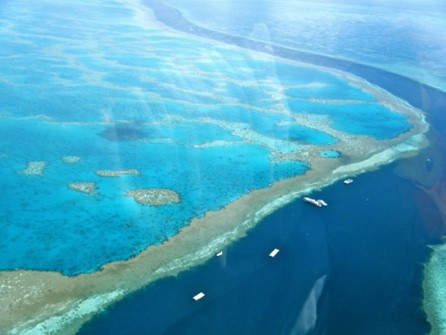
As mentioned above, there are classes for coral reefs: fringing, barrier, and atoll. The differences between their formations can be seen in Figure 8. The fringing reef forms at the low tide level, and it extends out from the coast like a terrace. Barrier reef is a rampart that lays parallel to the coast, and they are separated by a deep channel. An atoll is ring-shaped, and it surrounds the lagoon with no connection to land (Kan et al., 1997).
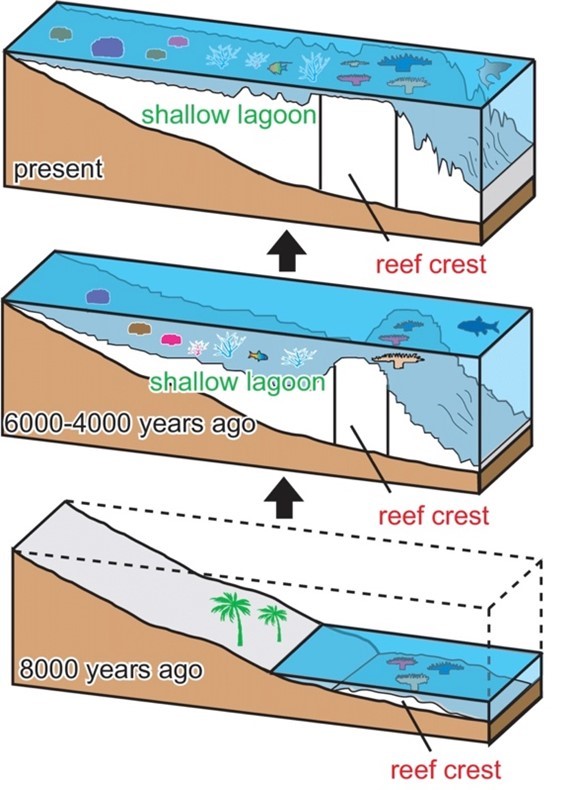
To form coral reefs, free-floating coral larvae first attach to hard surfaces, such as rocks, along the edges of land. They produce calcium carbonate throughout their lives, and a coral reef is formed by hundreds of these hard corals cementing together like a rigid skeleton. In order for the coral population to grow, polyps in the coral reef lift off their basal plates and form a new chamber so that new corals can grow on top of the calcium carbonate skeletons of their predecessors. As a result, coral reefs continue to grow as the population of corals grow and expand. The majority of the coral reefs today are between 5000 – 10000 years old, as seen in Figure 9 which illustrates the expansion of coral reefs through time. However, free space is required for these coral species to grow, and it is a very limited resource in the reef ecosystem. Coral species often have to compete with each other to maintain or gain space in their home — the coral reef. They use many methods to fight for their living space, and this includes sweeper tentacles that damage neighbour coral colonies, mesenterial filaments that can digest adjacent colonies externally, and fast growth to cover other corals and eliminate them by blocking sunlight (Salcedo-Sanz, 2016).
Interestingly, a coral reef can be thought of as a unique ecosystem consisting of multiple types of coral species and many other animals and plants. Inside a reef, coral colonies are formed by the same species of coral, and numerous of these colonies together compose a coral reef. Besides corals, the reef provides shelter and food for a large variety of fishes. Algae, mollusks, crustaceans and many other animals and plants live in the reef as well. They all contribute actively to the coral reef development (Salcedo-Sanz, 2016).
Already with a considerably limited space for corals to grow and multiply, how can the reef ecosystem further provide shelter for a diverse population of species? This is solved by a unique geometry with curved space and negative curvatures.
Hyperbolic Geometry of Coral Reefs
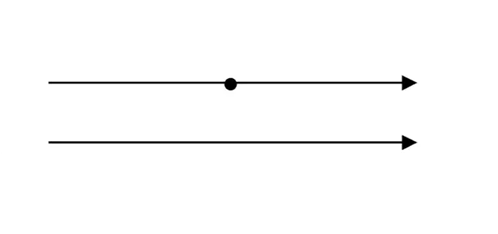
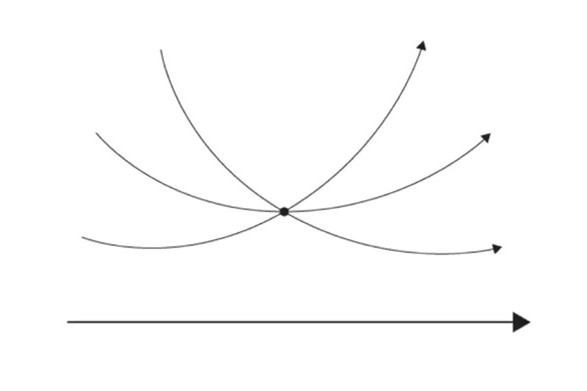
Hyperbolic geometry is a non-Euclidean geometry developed in the nineteenth century. This geometry, also referred as Lobachevskian Geometry, follows Euclidean postulates, except the parallel postulate that states that there is only one parallel line through a point to a given line (Fig. 10). As seen in Figure 11, there can be at least two lines parallel to the given line in a hyperbolic geometry (Farb & Margalit, 2017). Although one can say it is cheating since the lines look curved, the curved lines are due to the fact that the 2D diagram is a projection of the curved hyperbolic surface onto a flat plane. This is similar to projecting the surface of Earth onto a flat map — the straight lines of latitude and longitude become curved on the map.
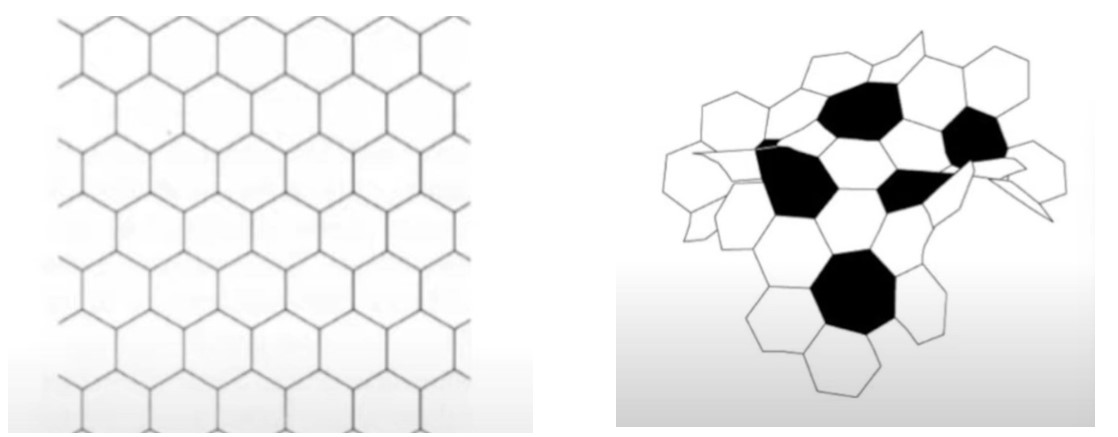
Although hyperbolic geometry was looked down upon when it was first discovered in the early 19th century, numerous examples of this geometry can be seen in nature, ranging from kelps to sponges to coral reefs to kale leaves. Nature uses hyperbolic geometry of the maximization of surface area of this geometry. Opposite of a sphere having the minimal surface area with respect to a fixed volume, a hyperbolic structure tries to maximize the surface area as can be seen in nature (Mahan, 2019). Kale leaves are hyperbolic geometries that absorb as much sunlight as possible. Sponges want as much contact to water as possible to obtain food, and they do so by increasing their surface area with a hyperbolic shape.
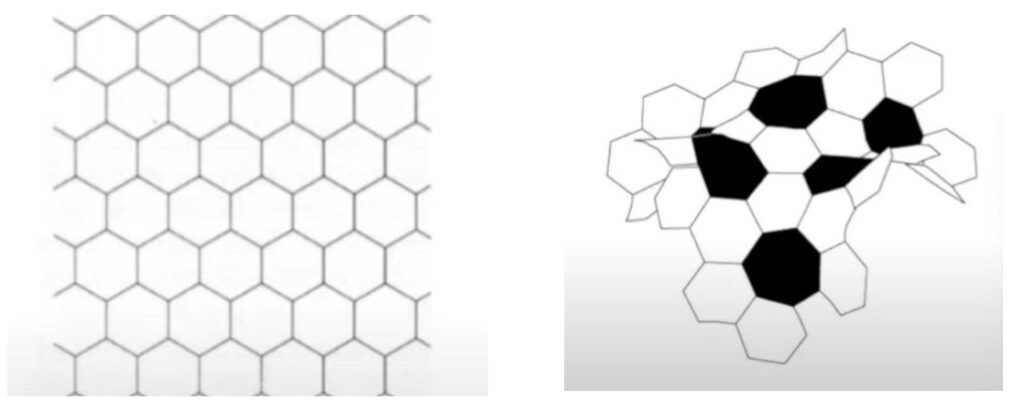
Similarly, by having highly crinkled surfaces, coral reefs take shape in curving and crenelated hyperbolic forms. Not restricted by Euclidean geometry, coral reefs are thus able to form hyper-abundant surfaces that are used to shelter species in the reef ecosystem. By having negative curvature and curved space, coral reefs can have considerably more surface areas in a fixed space compared to a flat Euclidean structure with zero curvature (Fig. 12). This is why an extremely diverse range of species and plants are able to live and prosper in the coral reef ecosystem’s limited space.
The next section will further explore interactions between the inhabitants of coral reefs and the effects of environmental factors on these species.
Ecology of Coral Reefs
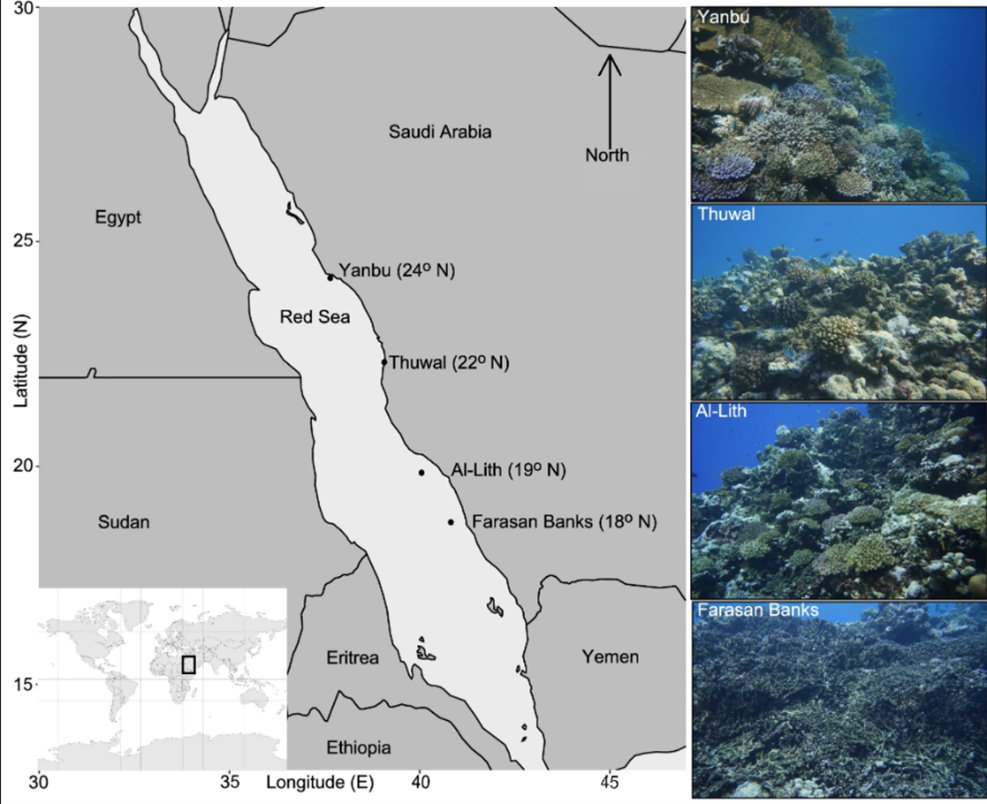
Coral reefs are complex habitats that are home to a wide array of biodiversity. Some notable reef locations include the Great Barrier Reef off the Australian coast and several sites in the Red Sea (Fig. 13). Coral itself is a living animal polyp classified under phylum Cnidaria in class Anthozoa. It performs cellular respiration and has a symbiotic relationship with zooxanthellae, a dinoflagellate algal protist (Heath, 2021). This section will present interactions and environmental factors affecting coral reef habitats, and mathematical equations describing these processes.
Effect of Temperature
Coral reefs are affected by local and global temperature changes. The steadily increasing temperature due to climate change is periodically accentuated by local weather phenomena such as El Niño Southern Oscillation (ENSO), which causes a marine heatwave. When corals reach their thermal limit, they expel their symbiotic zooxanthellae and die. This phenomenon is known as a bleaching event (Hammerman et al., 2021). The following equation, based on the toxicological lethal dose model, relates the percentage of coral that die at a certain temperature T (Anton et al., 2020).
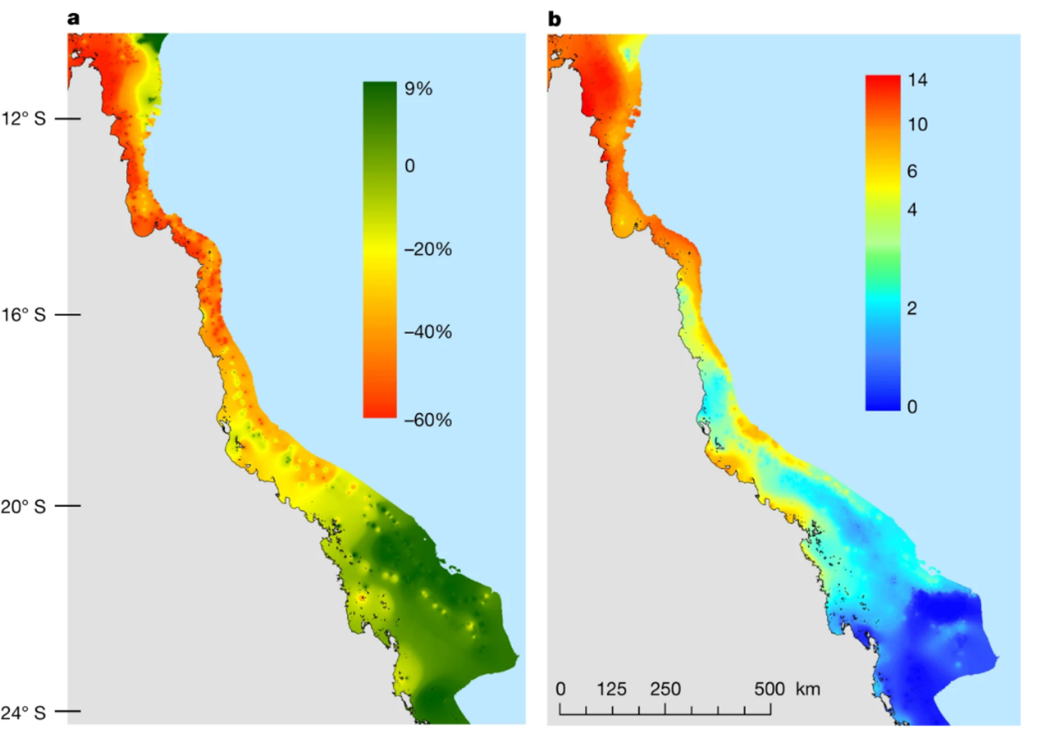
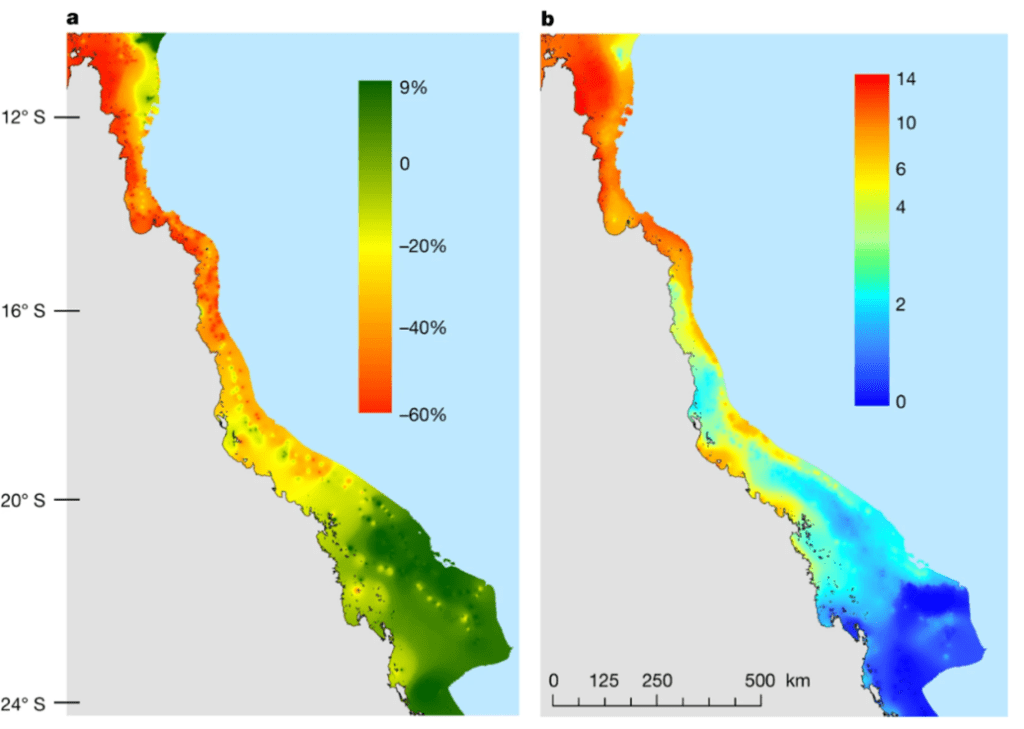
Mortality(\%)=\frac{100}{1+a(log(T)-log(LT_{50})}In this equation, ‘a’ is the slope of the dose curve and LT50 is an experimentally determined value that is specific to each species of coral. This value represents the temperature at which 50% of test corals die. Therefore, corals with a higher LT50 are more thermally resistant, while corals with a lower LT50 are more thermally sensitive (Anton et al., 2020). As marine temperatures rise, more thermally tolerant coral genera such as Porites are observed to replace less thermally tolerant genera such as Acropora in some regions of the Red Sea. (Hammerman et al., 2021). Additionally, algae are more thermally resistant than coral in general, so higher temperatures cause coral to die and be replaced by algae (Anton et al., 2020). Figure 14 shows the decline of coral ground coverage in the Great Barrier Reef as temperature increases (Hughes et al., 2018). This represents an important loss of biodiversity in coral reef ecosystems (Hammerman et al., 2021).
Eutrophication and Crown of Thorns
There are other environmental factors affecting coral reef ecosystems which are not related to temperature. Some of these effects are caused by human activity, while others are not. For example, eutrophication can result from naturally occurring cyclones or land shifts from coastal development (Spagnol et al., 2000). When a large amount of soil carrying nutrients slides into the ocean, algae proliferate and eventually begin to decompose. Aquatic bacteria then digest this algae, and respirate oxygen in the process. This causes the oxygen levels in the water to decrease significantly, leading to the death of marine animals including corals (National Oceanic and Atmospheric Administration, 2021). The following equation models the balance between coral abundance and algal abundance (Spagnol et al., 2000).
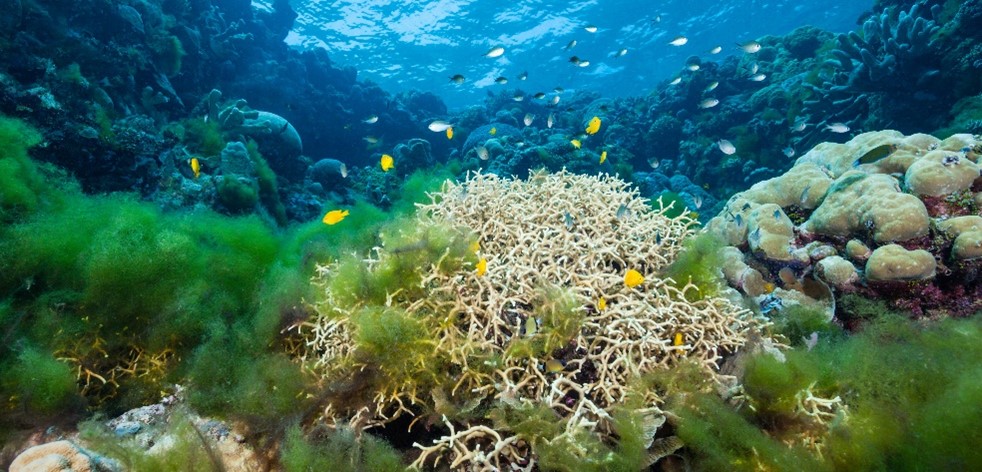
A = (1 - C_{a})H(-A-C_{a}+1)In this equation, ‘A’ is algal abundance, Ca is adult coral abundance and ‘H’ is the heavyside function whose value is zero unless the independent variable is greater than zero, then ‘H’ is 1. This equation was used in a mathematical simulation to study the effects of eutrophication due to human causes versus natural causes. The researchers concluded that “although the acute natural disturbances had the most severe short-term impacts, the system rapidly recovered, whereas the chronic human impact resulted in a long-term decline [of corals]” (Spagnol et al., 2000). Figure 15 shows a coral reef being overtaken by algae.
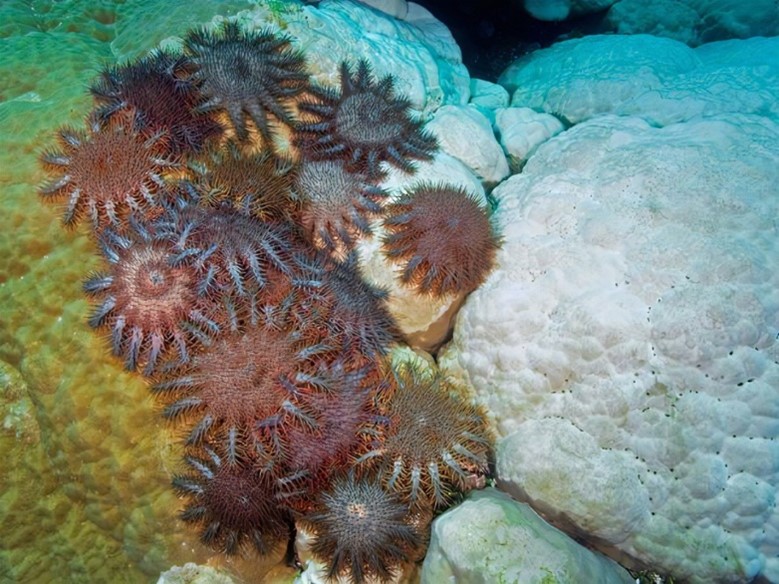
Another more peculiar predator that corals must contend with is the starfish species Acanthaster planci, commonly called Crown of Thorns or COTS (see Figure 16). This large echinoderm, which can measure up to 1 meter, feeds on hard coral. In normal quantities, COTS are beneficial to the ecosystem as they prevent overgrowth of coral. However, COTS outbreaks can occur because of eutrophication or over-fishing of their predators. These outbreaks are particularly deadly, as they decimate large areas of coral reefs, consuming 90% of live coral tissue (“Crown-of-Thorns Starfish,” n.d.).
Coral reefs are complex ecosystems housing a large biodiversity of species connected by trophic and symbiotic relationships. While these systems can usually recover from environmental perturbations and return to an equilibrium state, prolonged disturbances due to human activity and climate change are taking a permanent toll on these remarkable sea creatures. In the next section, a different group of animals residing underground is examined: mole-rats.
Mole-Rats
African rodents originating from the family Bathyergidae, better known as mole-rats, have the unique characteristic of building underground tunnel networks known as a burrow system to use as their home (Fig. 17). They often reside in colonies and construct their homes with the help of other members of the group. Some intricate parts of their housing include tunnels for foraging, nests, food storage, defecation, etc. (Le Comber et al., 2002). How mole-rats decide to build these structures and the properties that emerge during their subsequent construction will be the focus of this section.
Construction of Burrows
Mole rats typically spend their whole lives underground (Le Comber et al., 2002). As a result, behavioural and structural adaptations are required to build an adequate home system that fits this lifestyle. Some social adjustments include the cooperation of the colony in the construction of this tunnel system. This is thought to arise due to the aridity food distribution hypothesis, or AFDH for short. The AFDH stipulates that multiple factors affect the behavioural habits of mole rats: little-to-no rain creates a tough soil that impedes the burrowing process since it requires far more energy to dig, and the scarcity of food in arid habitat reduces the ability to disperse far from where an original food source is found (Spinks et al., 2000). In turn, this promotes cooperation in mole rats as a result of them congregating in areas that have little water as it would be energetically efficient to build these tunnels as a collective to reduce the amount of work done by each mole rat and find a food source in the process that, once found, can feed all of them due to its bundled nature (Sichilima et al., 2008; Spinks et al., 2000). Therefore, behavioural adaptations have caused Heterocephalus glaber , better known as the naked-mole rats, to work as a eusocial group in constructing their burrows (Le Comber et al., 2002).
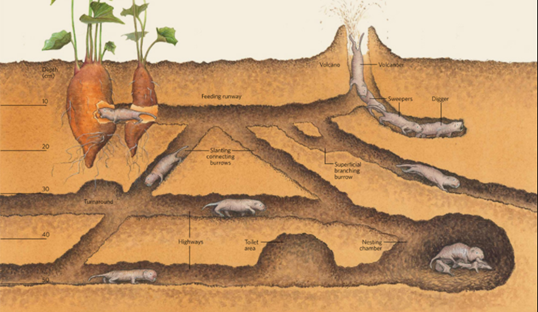
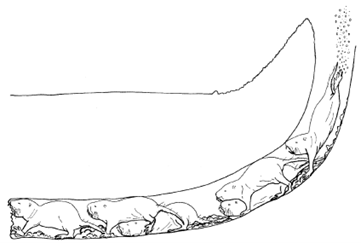
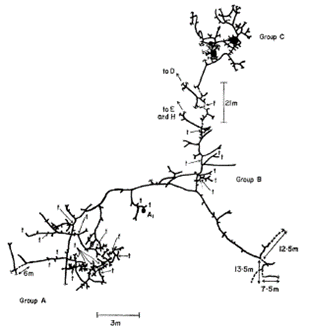
Figure 17 shows a typical burrow system made by Heterocephalus glaber. This consists of a slightly raised exit known as a molehill where the dug soil is removed, a nesting chamber where the workers are able to rest and produce offspring, a toilet area for defecation as to not contaminate the nesting chambers, and other elaborate components that allow for this lifestyle (Le Comber et al., 2002). Physical adaptations for these rodents enable them to construct their homes using incisors, located in their mouth, to bite at the dirt to loosen it and then by kicking the dirt in the opposite direction using their feet to clear a path (Jarvis & Sale, 1971). As they are species that live in colonies, they often form long chains and work together to dig the burrow by having one of them, a digger, use their incisors to loosen the dirt and the rest, sweepers remove the dirt by progressively kicking it in the opposite direction until it reaches a terminal mole-rat, a volcanoer, that kicks the dirt using its hind feet out of the burrow (Jarvis & Sale, 1971). The term volcanoing done by a volcanoer refers to the action of the final removal of the soil from the burrow via the molehill (Jarvis & Sale, 1971). Figure 18 demonstrates how these excavating chains are made to produce such burrow systems.
The adaptation have shaped the way mole rats construct their homes. In doing so, these animals have recurring patterns during the construction and maintenance of their burrows. Figure 19 represents a burrow system of Heterocephalus glaber that was observed by Jarvis & Sale (1971) during their research on the burrowing behaviour of these animals. They noticed that the presence of tubers (Vigna sp.), which is used as a food source by the mole rats, significantly increased the construction of branching burrows since tubers tend to grow in clumps. Due to the bunched nature of the food source as described by the AFDH, branching near such would increase the chances of exploiting it to its maximal capacity by finding yet more food. Hence, high branching can be observed near areas where a “t”, a position of exposed tubers, is found while long linear branches can be seen where a food source is not found (Fig. 19). Another research done by Spinks et al. (2000) tested the effect of the environment on the ecology of populations of Cryptomys hottentus, another type of mole-rat, by placing them in either mesic or aridic environments. They determined that burrowing systems in arid environments were longer than their mesic counterpart. This observation supports that burrow length is correlated to the availability of food, as arid environments have scarce and clustered food sources and therefore more excavation is required to find such food sources (Spinks et al., 2000). Clearly, different arrangements can be recognized during the formation of burrowing systems, which can be further quantified using fractal analysis as seen in the next section.
Fractal Dimensions
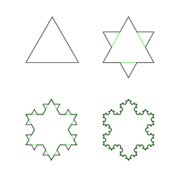
A fractal is a never-ending pattern with constant similarities at different scales. A common example used to visualize such a phenomenon is Koch’s snowflake (Fig. 20), where at different scales (i.e., the range at which one looks at the figure), a reoccurring shape can be observed. Fractal analysis using fractal dimensions is used in mathematics to determine a ratio between a certain difference in a fractal’s detail when the scale that is used to measure the fractal’s detail changes.
One method to determine such a ratio is using the Minkowski-Bouligand dimension, also known as box-counting dimension, where the number of boxes required to cover a given fractal on a flat surface is measured to determine the change in this number as the boxes become smaller in size (Le Comber et al., 2002). This is given by the following equation:
D_{B}=\lim_{\epsilon \to 0}\frac{logN(\epsilon)}{log(\frac{1}{\epsilon})}Where N(ε) represents the number of boxes of side length ε that are required to cover the fractal on a flat surface and DB represents the fractal dimension and its corresponding measure of the degree to which the number of boxes fills this flat structured fractal (Le Comber et al., 2002).
One application in mole rats burrowing patterns is to give a more accurate description of how thorough mole rats explore the environment that they are excavating by comparing the quantity of surrounding area that is within a certain measured distance to at least a part of the burrow system (Le Comber et al., 2002). Since high burrow branching is expected near areas with a food source as seen in the previous section, and different environments have different food availability, it is likely that arid areas will have a lower fractal dimension while mesic areas will have a higher fractal dimension due to the change in branching as the food supply increases (Le Comber et al., 2002). This was proven by Le Comber et al’s (2002) research about the relationship between environmental factors on different species of mole rats and corresponding fractal dimensions, as they found that for the common mole rat, Cryptomys hottentus, burrows in arid environments had statistically lower fractal dimensions DB than the ones in mesic environments. This proves once more that the burrow construction is heavily influenced by the availability of food, as this is ultimately what enables them to survive. Another research performed by Sichilima et al. (2008) had the objective to determine the connection between fractal dimensions and ecological properties related to burrow construction. They found that precipitation has a statistically significant impact on fractal dimensions, signifying that more branching is expected when the soil is wet as opposed to dry, likely due to the fact that less energy is needed to excavate softer soil when it is wet as opposed to dry one. As a result, this mathematical analysis enables the quantification of burrowing patterns, specifically that of burrow branching, and shows the influence of environmental factors during the home excavation periods.
Burrow system construction by mole rats has been evolutionary shaped by their overall behaviour, as explained by the AFDH, and structural adaptations through the large incisors and kicking motions. The construction of their home has clearly demonstrated a pattern creation through the correlation between the availability of food and burrow length as well as branching near food sources, with its quantification arising through the usage of fractal dimensions. Overall, this section’s analysis demonstrates how evolution has caused a formation of a recuring effect in the home construction of the mole-rats.
Conclusion
This essay has shown and analyzed different mathematical models that affect animals’ homes. While each animal home is unique due to its particular environment, from the soil used in ant hills and mole rats’ burrows to the ocean containing coral reefs, one thing remains similar: each ecosystem exhibits recurring patterns and quantifiable relationships that allow each animal to prosper in its habitat. They take advantage of the resources that surround them to build fascinating shelters that are crucial for their survival. However, animals face the added challenge that their environment is constantly changing. Therefore, they are constantly adapting their structures to maintain an equilibrium between their colonies and the surrounding ecosystem. This feat of mathematical optimization once again demonstrates animals’ incredible adaptability. The observation of animal activities is truly a humbling experience for human engineers. While humans require computers to solve complex optimization problems, animals have developed these systems naturally over the course of evolution, and they execute their architectural activities instinctively.
References
Adams, E. S. (1998). Territory Size and Shape in Fire Ants: A Model Based on Neighborhood Interactions. Ecology, 79(4), 1125-1134. https://doi.org/10.2307/176731
Anton, A., Randle, J. L., Garcia, F. C., Rossbach, S., Ellis, J. I., Weinzierl, M., & Duarte, C. M. (2020). Differential thermal tolerance between algae and corals may trigger the proliferation of algae in coral reefs. Glob Chang Biol, 26(8), 4316-4327. https://doi.org/10.1111/gcb.15141
Claggett, J. (2012, June 1). starfish05-crown-of-thorns-starfish_18224_600x450. flickr. Retrieved October 8, 2021, from https://www.flickr.com/photos/farhaven/7322882634/
Comber, S. C. L., Spinks, A. C., Bennett, N. C., Jarvis, J. U., & Faulkes, C. G. (2002). Fractal dimension of African mole-rat burrows. Canadian Journal of Zoology, 80(3), 436-441. https://doi.org/10.1139/z02-026
Crown-of-Thorns Starfish. (n.d.). Great Barrier Reef Foundation. Retrieved November 26, 2021, from https://www.barrierreef.org/the-reef/threats/Crown-of-thorns%20starfish
Farb, B., & Margalit, D. (2012). A Primer on Mapping Class Groups (PMS-49). Princeton University Press. http://www.jstor.org/stable/j.ctt7rkjw
Fringing reef. (2021, September 21). In Wikipedia. Retrieved November 26, 2021, from https://en.wikipedia.org/w/index.php?title=Fringing_reef&oldid=1045587780
Fujita, K., Arakaki, T., Denda, T., Hidaka, M., Hirose, E., & Reimer, J. (2015). Nature in the Ryukyu Archipelago.
Goryunov, D. N. (2015). Nest-building in ants Formica exsecta (Hymenoptera, Formicidae). Entomological Review, 95(8), 953-958. https://doi.org/10.1134/s0013873815080035
Hammerman, N. M., Rodriguez-Ramirez, A., Staples, T. L., Decarlo, T. M., Saderne, V., Roff, G., Leonard, N., Zhao, J.-X., Rossbach, S., Havlik, M. N., Duarte, C. M., & Pandolfi, J. M. (2021). Variable response of Red Sea coral communities to recent disturbance events along a latitudinal gradient. Marine Biology, 168(12). https://doi.org/10.1007/s00227-021-03984-y
Heath, H. (2021, March 3). Does coral have respiratory system? Rampfesthudson.com. Retrieved November 26, 2021, from https://rampfest-hudson.com/does-coral-have-respiratory-system/
Hughes, T. P., Kerry, J. T., Baird, A. H., Connolly, S. R., Dietzel, A., Eakin, C. M., Heron, S. F., Hoey, A. S., Hoogenboom, M. O., Liu, G., McWilliam, M. J., Pears, R. J., Pratchett, M. S., Skirving, W. J., Stella, J. S., & Torda, G. (2018). Global warming transforms coral reef assemblages. Nature, 556(7702), 492-496. https://doi.org/10.1038/s41586-018-0041-2
ISS014-E-19882. (2007, April 20). National Aeronautics and Space Administration. Retrieved November 26, 2021, from https://eol.jsc.nasa.gov/SearchPhotos/photo.pl?mission=ISS014&roll=E&frame=19882
Jarvis, J. U. M., & Sale, J. B. (1971). Burrowing and burrow patterns of East African mole-rats Tachyoryctes, Heliophobius and Heterocephalus. Journal of Zoology, 163(4), 451-479. https://doi.org/https://doi.org/10.1111/j.1469-7998.1971.tb04544.x
Jochem, F. (2007). Marine Biology and Oceanography. FIU course OCB3043. Retrieved November 26, 2021, from http://www.jochemnet.de/fiu/OCB3043.html
Kan, H., Hori, N., & Ichikawa, K. (1997). Formation of a coral reef-front spur. Coral Reefs, 16(1), 3-4. https://doi.org/10.1007/s003380050052
Khuong, A., Gautrais, J., Perna, A., Sbai, C., Combe, M., Kuntz, P., Jost, C., & Theraulaz, G. (2016). Stigmergic construction and topochemical information shape ant nest architecture. Proc Natl Acad Sci U S A, 113(5), 1303-1308. https://doi.org/10.1073/pnas.1509829113
Koch snowflake. (2021, October 18). In Wikipedia. Retrieved November 26, 2021, from https://en.wikipedia.org/w/index.php?title=Koch_snowflake&oldid=1050543572
Lou, S. (2009, December 27). Amazing Great Barrier Reef. flickr. Retrieved October 8, 2021, from https://www.flickr.com/photos/sackerman519/4251357083
MJ, M. (2019, November 15). The ubiquity of Hyperbolic Geometry. Research Matters. Retrieved Novermber 26, 2021 from https://researchmatters.in/news/ubiquity-hyperbolic-geometry
National Oceanic and Atmospheric Administration. (2021, February 26). What is eutrophication? National Ocean Service. Retrieved November 26, 2021, from https://oceanservice.noaa.gov/facts/eutrophication.html
Newnham, C. M. (2016, July 20). What Happens When a Coral Reef Dies? Hakai Magazine. Retrieved October 8, 2021, from https://hakaimagazine.com/news/what-happens-when-coral-reef-dies/
Park, T. J., & Buffenstein, R. (2012, June 1). Digging the Underground Life. The Scientist. Retrieved October 8, 2021, from https://www.the-scientist.com/infographics/digging-the-underground-life-40923
Salcedo-Sanz, S. (2017). A review on the coral reefs optimization algorithm: new development lines and current applications. Progress in Artificial Intelligence, 6(1), 1-15. https://doi.org/10.1007/s13748-016-0104-2
Sichilima, A. M., Bennett, N. C., Faulkes, C. G., & Le Comber, S. C. (2008). Evolution of African mole‐rat sociality: burrow architecture, rainfall and foraging in colonies of the cooperatively breeding <i>Fukomys mechowii</i>. Journal of Zoology, 275(3), 276-282. https://doi.org/10.1111/j.1469-7998.2008.00439.x
Spagnol, S., Wolanski, E., & McCook, L. (2000). Modelling and Visualizing Interactions between Natural Disturbances and Eutrophication as Causes of Coral Reef Degradation. In (pp. 113-125). https://doi.org/10.1201/9781420041675.ch8
Spinks, A. C., Bennett, N. C., & Jarvis, J. U. M. (2000). A comparison of the ecology of two populations of the common mole-rat, Cryptomys hottentotus hottentotus: the effect of aridity on food, foraging and body mass. Oecologia, 125(3), 341-349. https://doi.org/10.1007/s004420000460
Theraulaz, G., Bonabeau, E., Nicolis, S. C., Sole, R. V., Fourcassie, V., Blanco, S., Fournier, R., Joly, J. L., Fernandez, P., Grimal, A., Dalle, P., & Deneubourg, J. L. (2002). Spatial patterns in ant colonies. Proc Natl Acad Sci U S A, 99(15), 9645-9649. https://doi.org/10.1073/pnas.152302199
Wycoff, M. (2008). Margaret Wertheim: Complexity, Evolution and Hyperbolic Space. Evolution: Education and Outreach, 1(4), 531-535. https://doi.org/10.1007/s12052-008-0079-y